Reports
Reports are flexible documents that can be used for anything from key metrics updates and dashboards, to deep dive analysis or personal explorations.
1. Create a new report
Start by going to the All reports page, and press Add report. Give your new report a title.
All reports
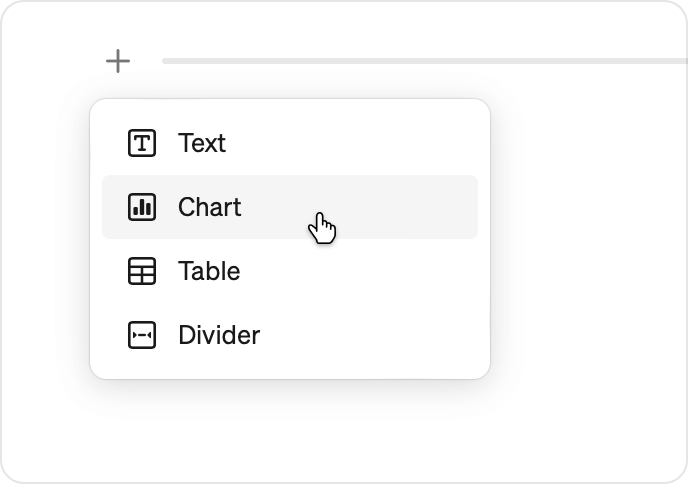
2. Add a chart block
Add any metric view to your report as a chart block.
- Press the Chart button in an empty report, or hover anywhere in an existing report to reveal the + button.
- Select a metric in the dropdown to start exploring it.
- Just like when exploring metric, you can customize time period, change between daily/weekly/monthly time grain, break it down by dimensions and more.
- For rolling periods on daily time grain, you can also toggle Include today in chart options.
- Customize your view and and press Done when you are happy to add it to the report.
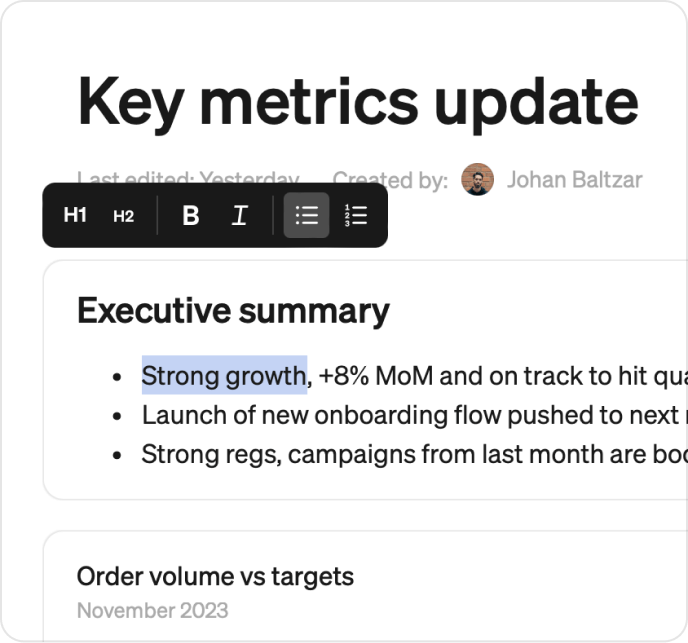
3. Add a text block
Click the + button and select Text to add an empty text block. Write your text and use the menu options to style it however you want.
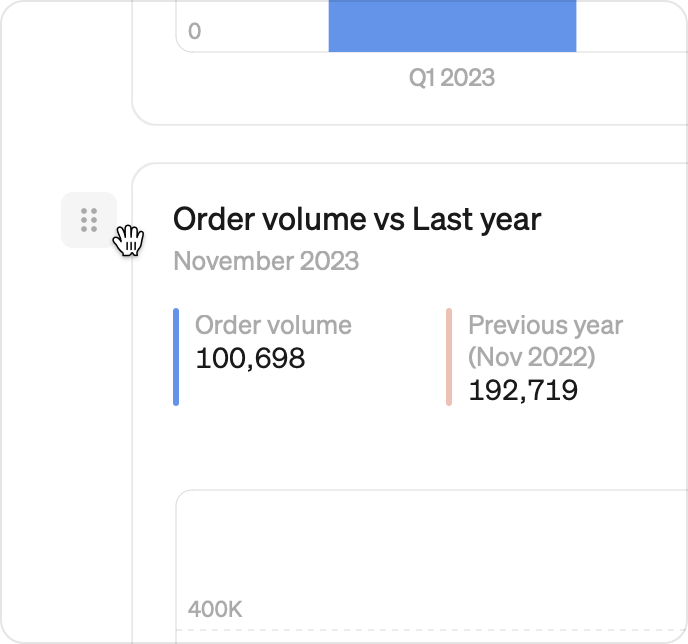
4. Drag and drop
Any content block in a Steep report can be dragged and dropped around the page.
- Hover over any block of content and use the
⋮⋮icon that appears as a handle to to drag it around. - Blue guides will appear and show you where it will go.
- Release the block to drop it wherever you want it.
- Dropping a block to the left or right of another block will create a two-column layout.
5. Share
Use the Share menu in the upper right to control who can view and edit the report. Share it with everyone in your workspace and use Copy link to send them a link.
All done 🎉
Congratulations - you have now connected your database, defined your first metrics and created a first report. You got this!
What to do next
From here on you can continue by:
- Inviting more users to your workspace
- Build out and organize your metrics catalog
- Learn the different ways to explore and analyze your metrics
- Customize for different teams with team spaces
- Setting up company targets
- Define metrics in code by connecting your dbt project