The nice thing with metrics is that you define them in one central place and can then use them dynamically for both deep dives and overviews of your data. Once defined, a metric automatically gets an explore mode for everyone to freely analyze and you can quickly create widgets for metrics.
Metrics are quick to set up, easy to maintain, and scales well as you grow.
More about the metrics concept
Admins only
Admins can create, edit and delete metrics
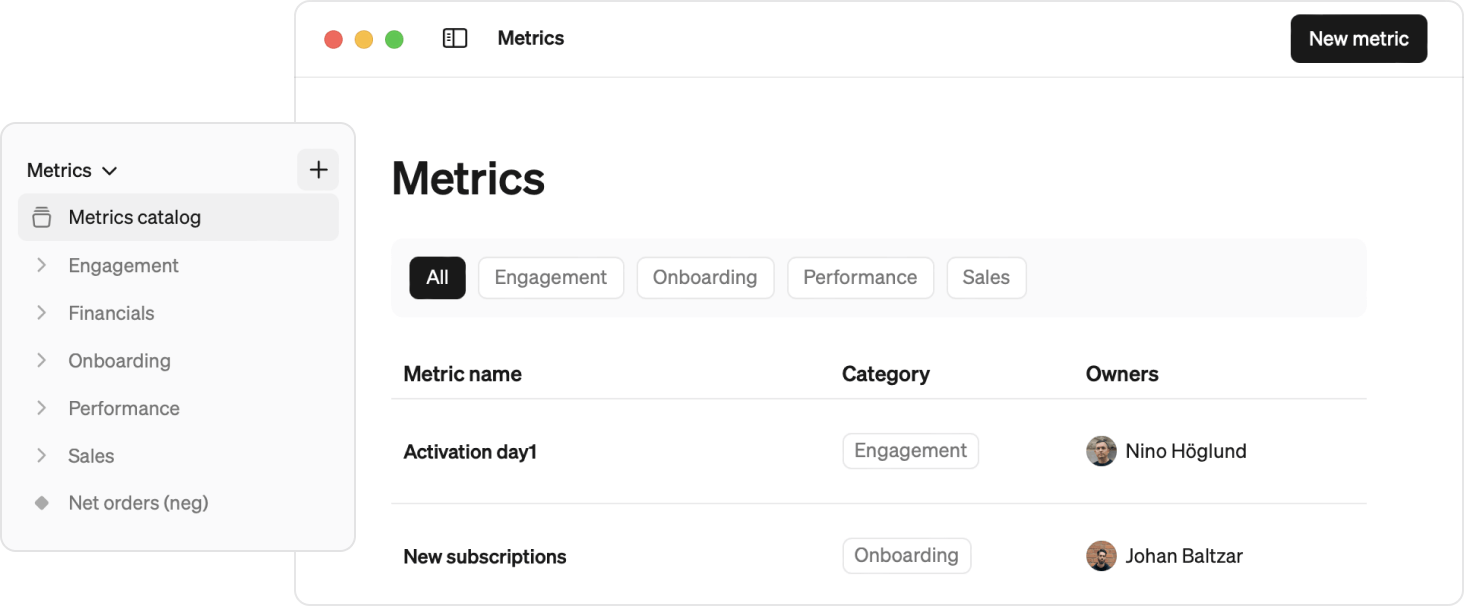
Create new metric
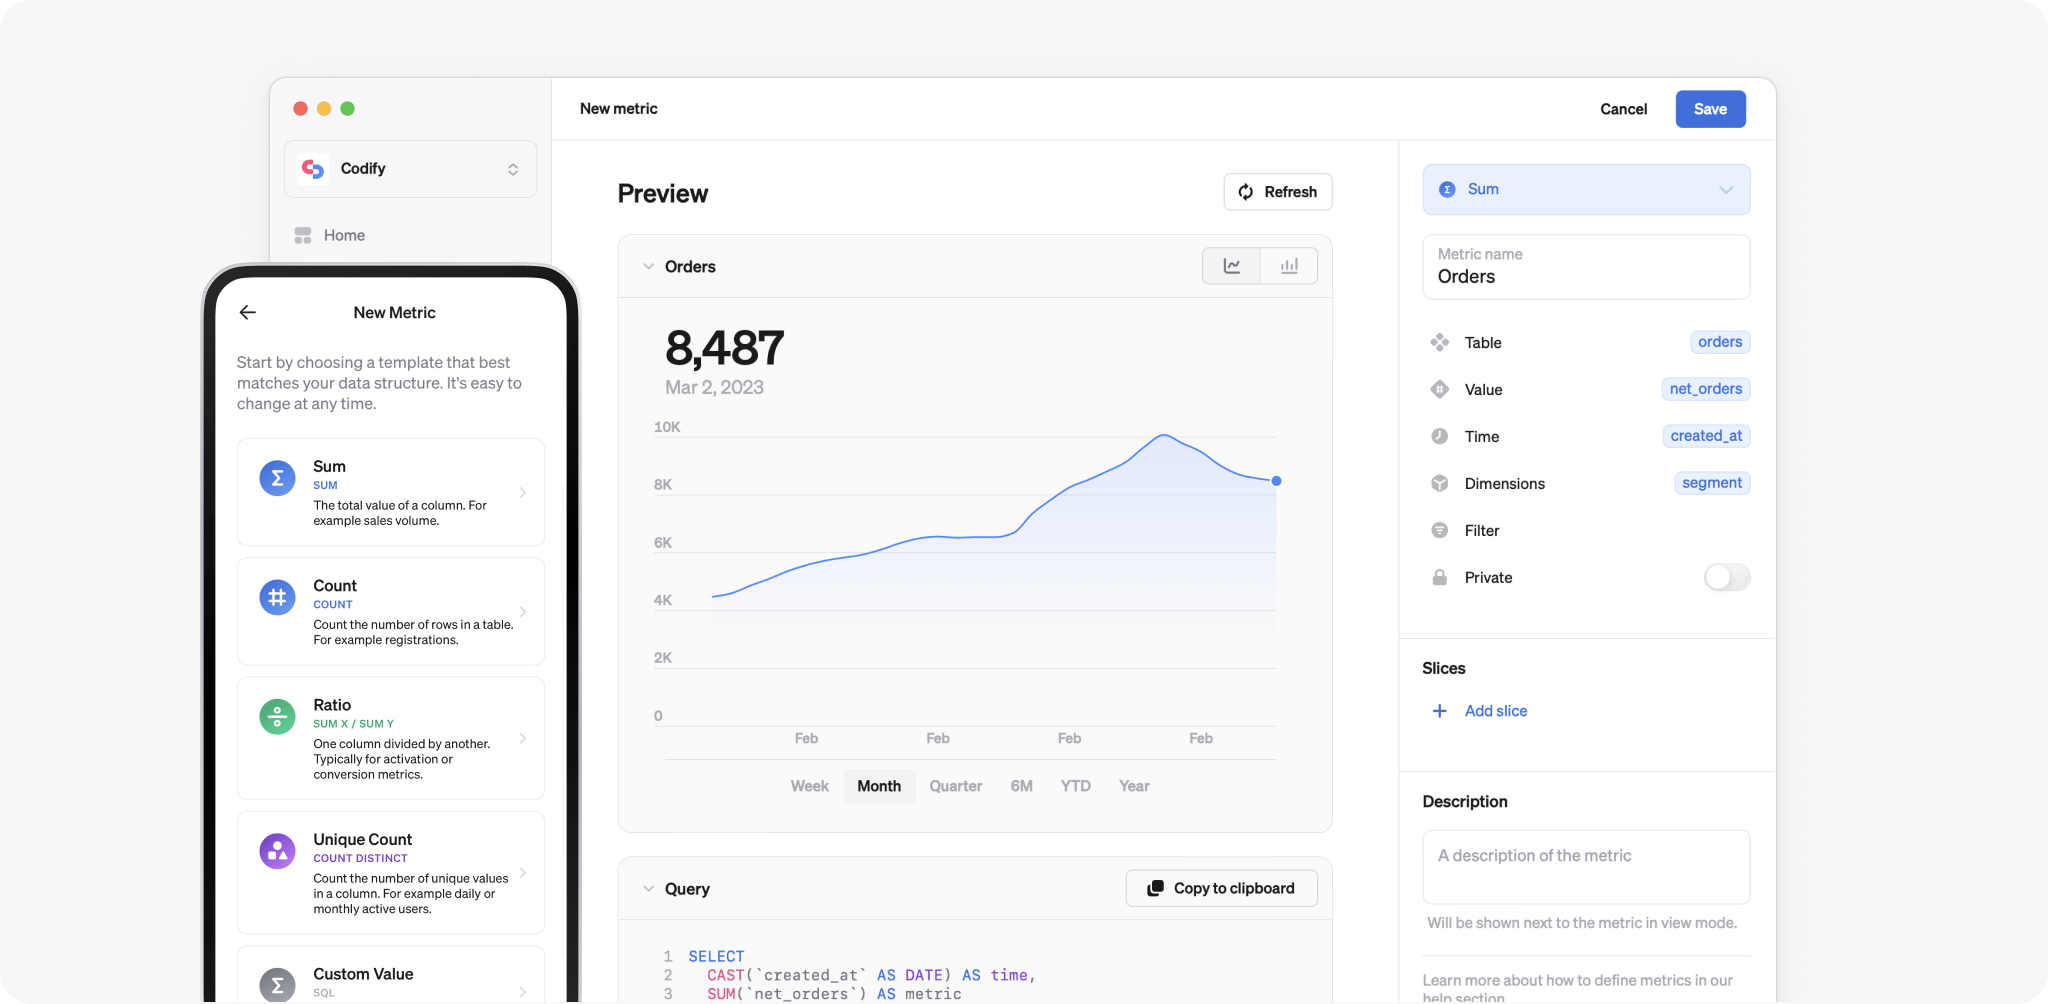
Create a new metric by choosing New metric on the metric catalog page. You can also do it quickly by clicking '+' next to 'Metrics' in the menu. On mobile, go to the Metrics tab and tap the New metric button.
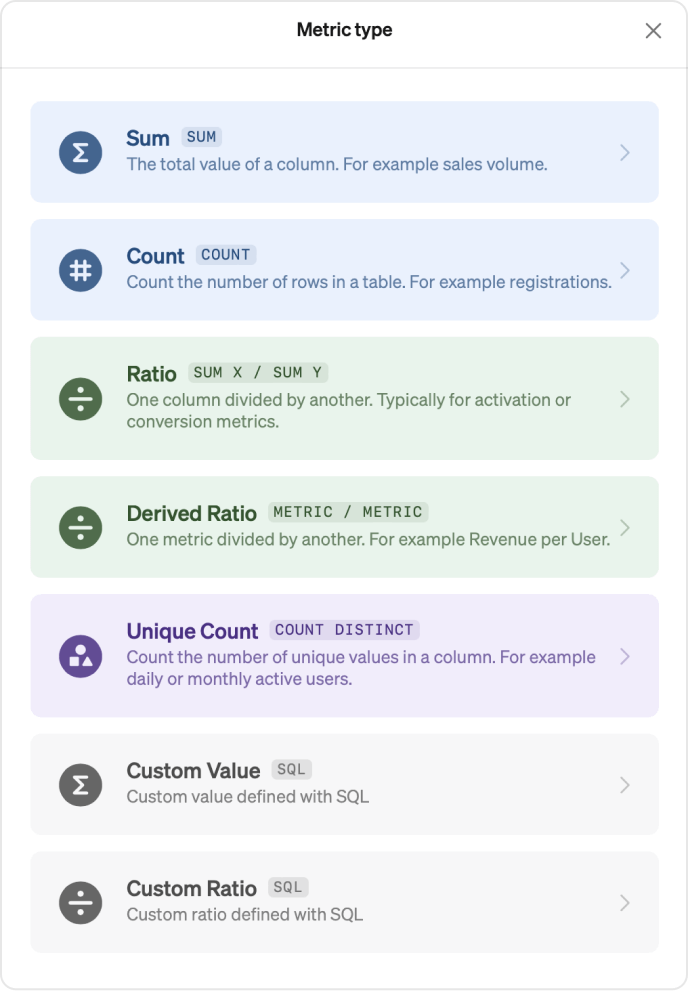
Select one of the templates:
| Type | Description |
|---|---|
| Sum | calculates the total value of a column |
| Count | counts the number of rows in a table |
| Ratio | divides one column by another |
| Derived Ratio | divides one metric by another |
| Unique count | counts the number of unique values in a column |
| Custom value | allows you to write your own SQL expression |
| Custom ratio | divides one custom SQL expression with another |
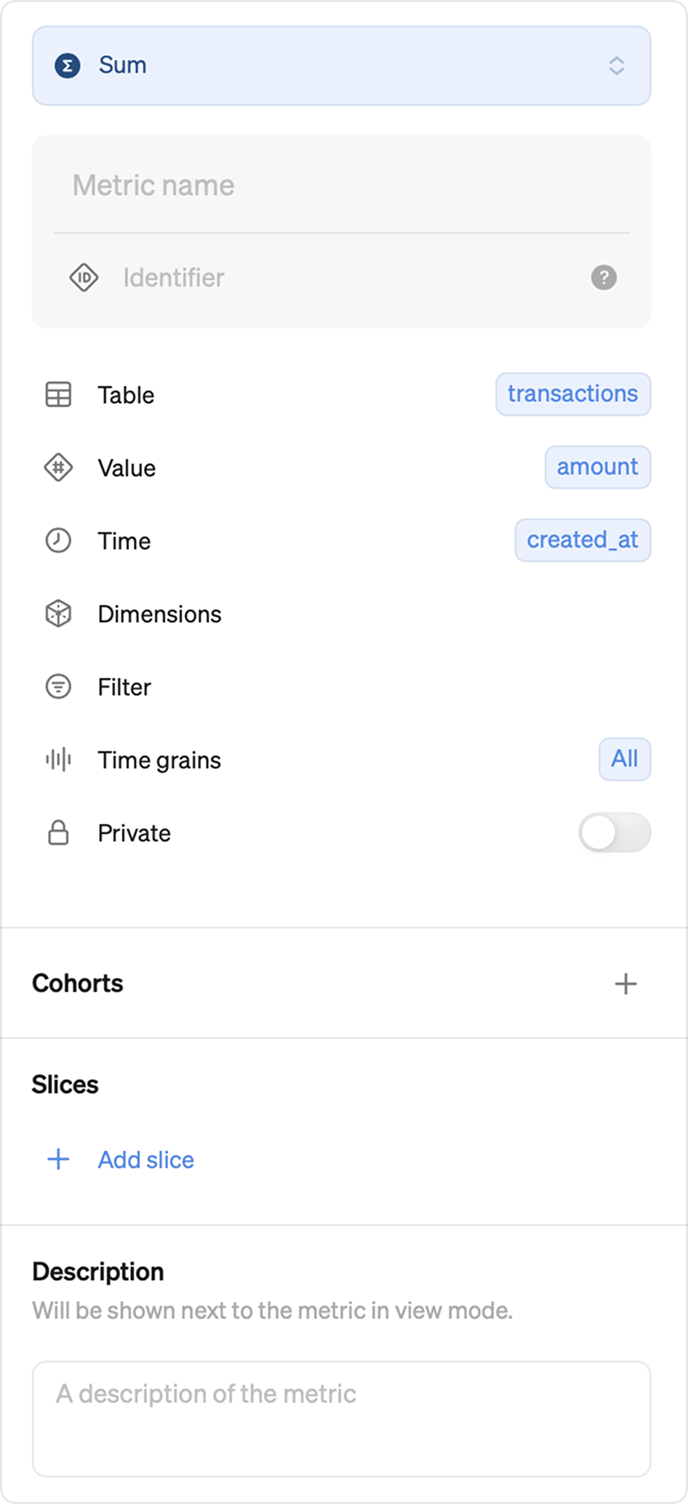
Define the basics
A metric must at least have a Identifier Table, Value, Time, and a Name.
Identifier
A metric identifier is auto-generated, editable, and stays constant even if the name changes.You use this identifier when referencing a metric from external sources.
Select a Table
Press the Table field and select a table or view from your database.
Select Value
Press the Value field and select a column from your table. This will be used to aggregate and calculate your metric value.
If you selected Ratio as template before, you will instead get two fields here, Converted and Base, that work in the same way and calculates a percentage.
If you selected a custom template you will instead write a custom SQL expression here.
Select Time
Press the Time field and select a column. This will be used to plot and analyse your metric over time.
Preview metrics
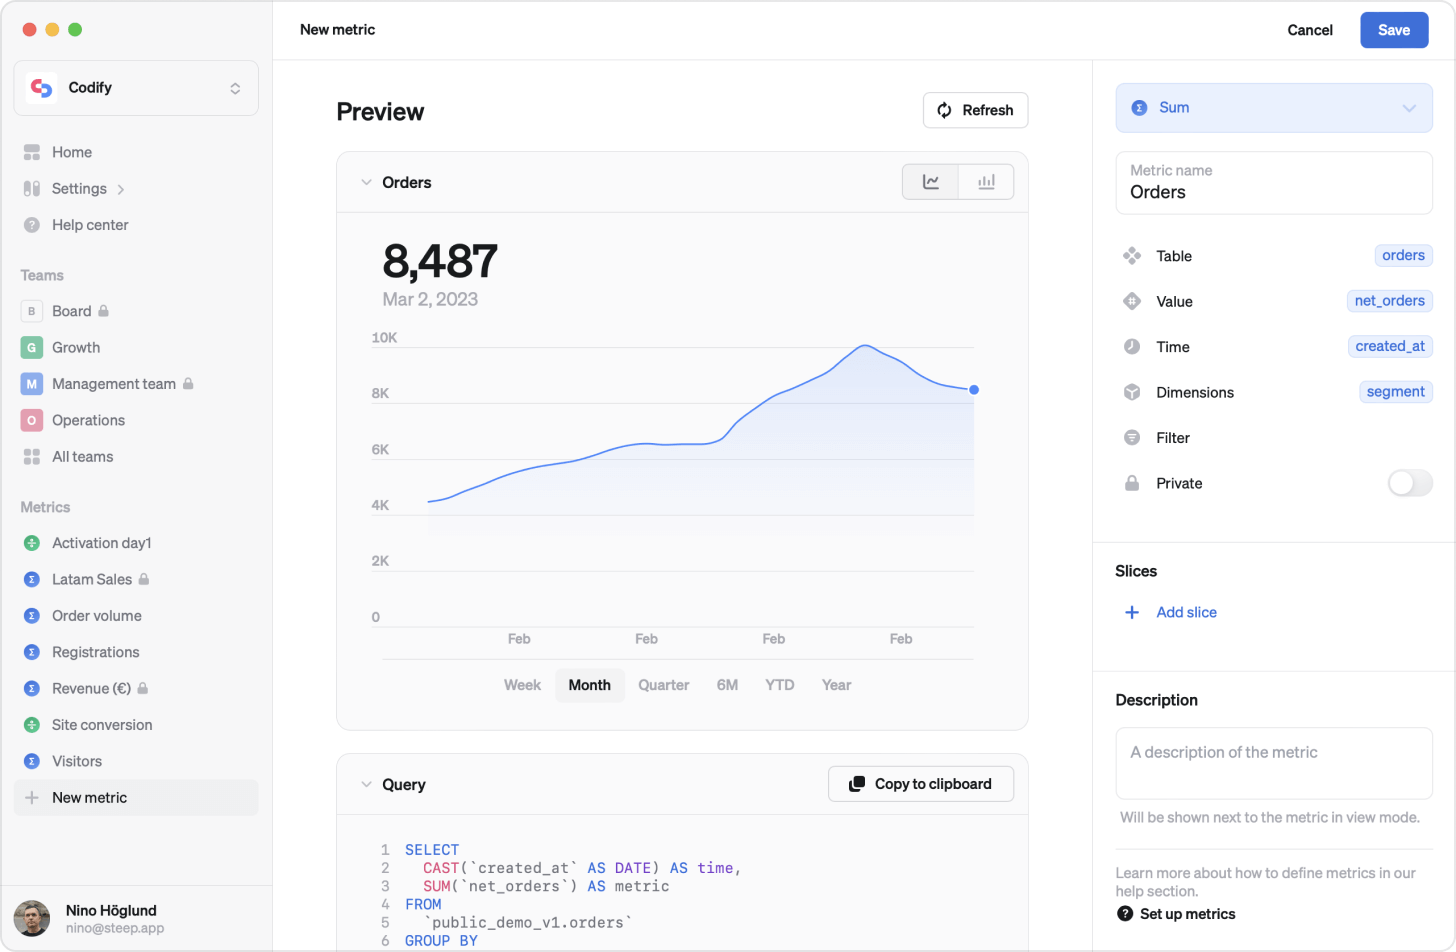
When the basics are defined you will automatically get a preview of your metric. You will get a number and a graph to help you validate that the metric is set up as intended. You will also get the query Steep generates to give you full visibility and control. The query can easily be copied so you can run it in any other tool you make use for SQL.
Any time you make a change to your metric definition and want to preview the results – just hit Refresh.
Metric properties
Beyond the basics basics, table, value and time, there are many more options for defining a metric.
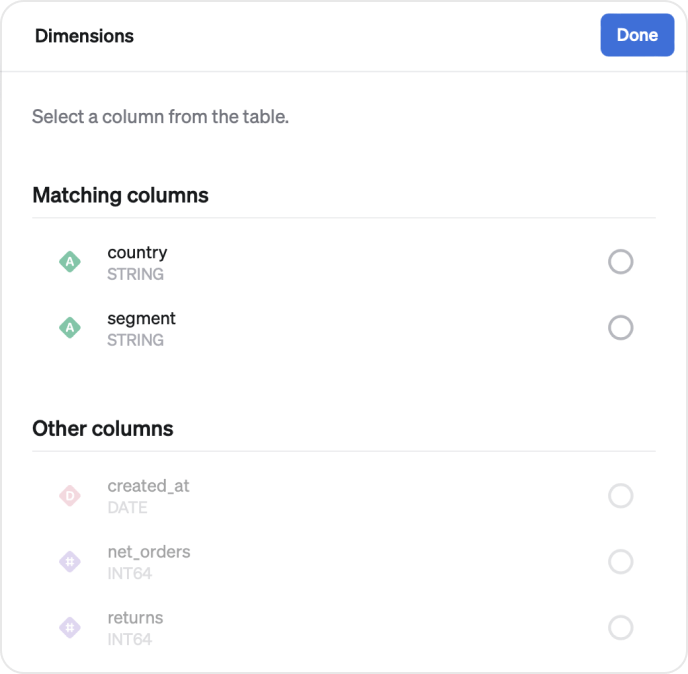
Dimensions
Dimensions provide breakdowns for your metric, for example by market, channel or product category.
To set up Dimensions, press the Dimensions field and select one or more columns from your table. To add Dimensions from other tables, you can create joins between Modules.
Numerator only dimensions
For derived ratio metrics, dimensions from the numerator metric can be applied. This allows you to filter the numerator while leaving the denominator unchanged.
View dimensions in explore mode
Please note
Once you’ve defined a dimension, it can be explored freely by every member in explore mode.
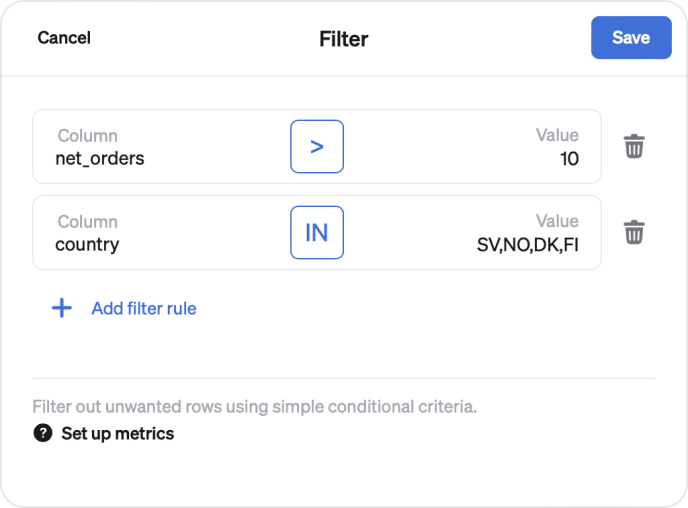
Filter
A metric can have one or more filters. It can be used to filter out unwanted rows in your metric, for example a specific country with noisy data.
A filter affects the whole metric including its slices.
Filters are based on simple conditional statements consisting of:
- A column (eg ‘country’)
- A condition (equal to, not equal to, less than, greater than, in or not in.)
- A value that should be matched (eg ‘se’)
- Together these are combined into a conditional statement. (Example: country = ‘se’ )
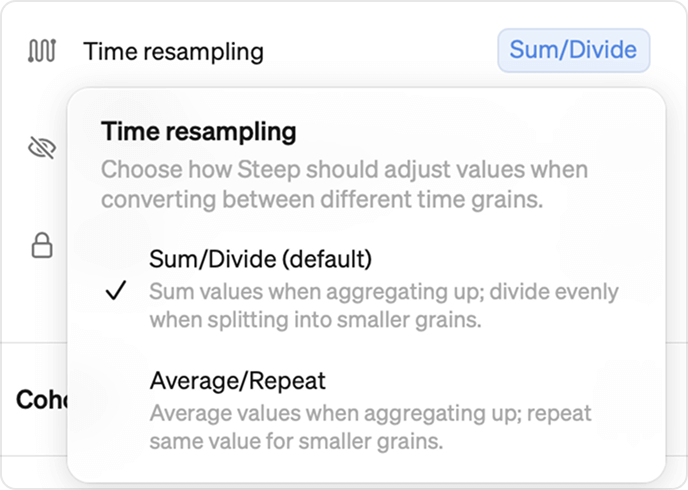
Time resampling
Steep handles aggregation and interpolation of target values based on the metric template type. How values are calculated depends on whether you're aggregating across time or dimensions.
There are two resampling methods:
- Sum/Divide: Adds values or divides them proportionally (e.g. summing daily values into weekly).
- Average/Repeat: Averages values or repeats the same value across the time range.
The default method depends on the metric template type, but you can override it when defining or editing a metric.
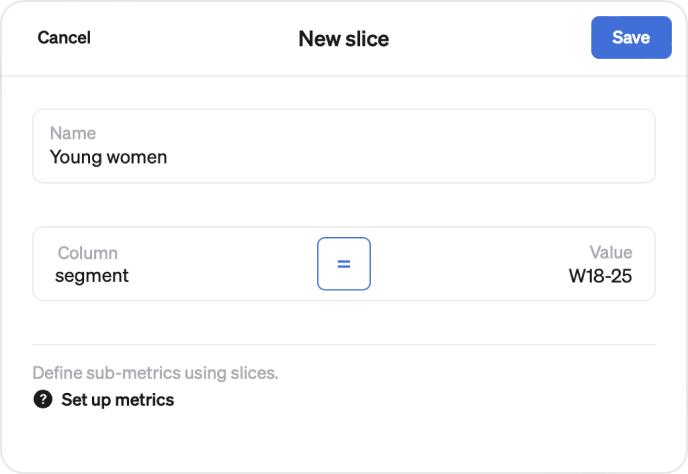
Slices
Slices are like sub-metrics. Once set up they provide an easy way to slice up your metric in explore mode, for example to find your high priority market Europe quickly. The source of truth is still the same as for the main metric.
Slices can have their own widgets. Slices are based on simple conditional statements, just like filters, consisting of:
- A column (eg ‘country’)
- A condition (equal to, not equal to, less than, greater than, in or not in.)
- A value that should be matched (eg ‘se’)
- Together these are combined into a conditional statement. (Example: country = ‘se’ )
Unlisted metric
Sometimes, you may want to create metrics that are only used as building blocks for other, derived metrics. In that case, you can set the metric to unlisted.
Unlisted metrics are only visible to admins in the metric catalog and cannot be added as charts to reports or as widgets to a home or team screen. However, anyone in the workspace can still view an unlisted metric—for example, if they have a direct link.
By default, all metrics are listed.

Private metric
By default all metrics are public. To limit access to specific metrics they can be set to private and connected to a private teams.
Read more about Private teams and metrics

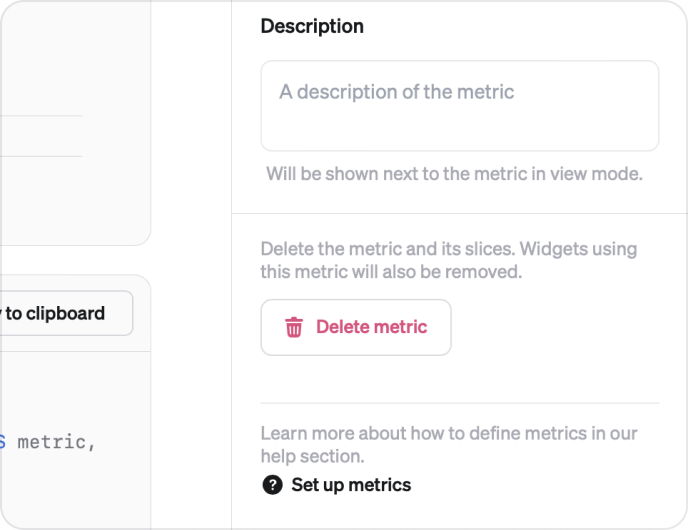
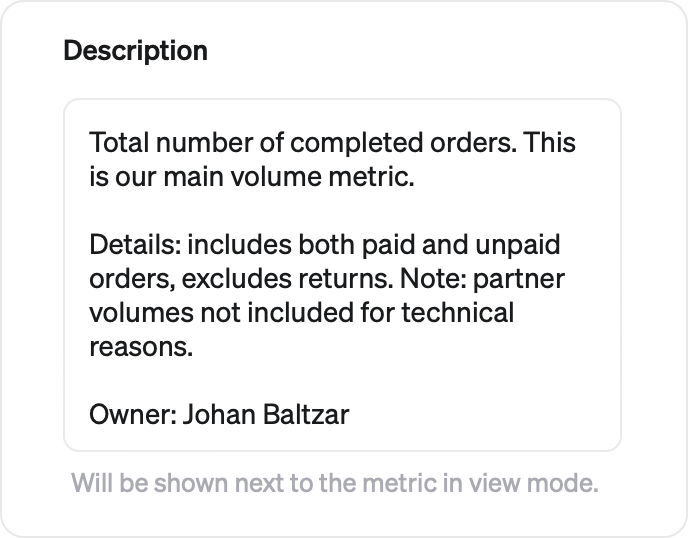
Description
Sharing metrics with a wider audience will sometimes require some context. You can add a description to go with your metric to make it easy for anyone in your organisation to understand what they are looking at.
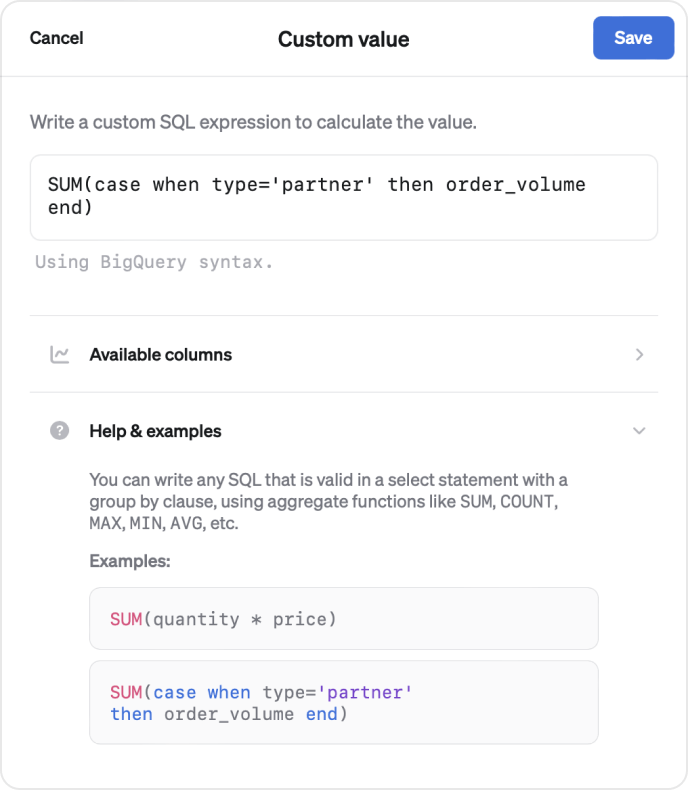
Custom templates
You can create custom metric definitions with SQL for when the built-in templates are not enough. This lets you add virtually any type of metric to Steep. Create a new metric and chose one of the templates - Custom value with a single SQL expression - or Custom ratio to divide one value with another.
A list of all available columns is there to guide you next to the SQL expression field. Preview mode will also be a good help to validate the result of your query matches your intent.
Edit metric
- Go to any metric.
- Pick Edit in the top right corner.
Note
Editing a metric updates all widgets connected to this metrics across you workspace.
Delete metric
- Go to the metric you want to delete.
- Pick Delete in the bottom of your edit metric fields.
Please note
This action will also remove all dashboard widgets and comments that may have been created for this metric.