Intro to cohort analysis
Cohort analysis is a method to track how different groups of users behave over time. A cohort represents a group of users with shared characteristics, for instance:
- Users who began using your product in a specific month
- Users from a particular country or segment
While a cohort can also refer to (for example) a group of products, it's usually about users.
Cohort analysis involves examining how these groups of users behave over time. For example, you might observe how many of them return each month, or how much they spend over time.
Some scenarios where you might use cohort analysis:
- Activation analysis - Group users by their start date and monitor their activation progress over time.
- Retention analysis - Group users by their start or activation date and observe how many continue to use the product over time.
- Revenue analysis and customer lifetime value - Group users by their start or first purchase date to identify trends in revenue and customer lifetime value.
Exploring cohorts
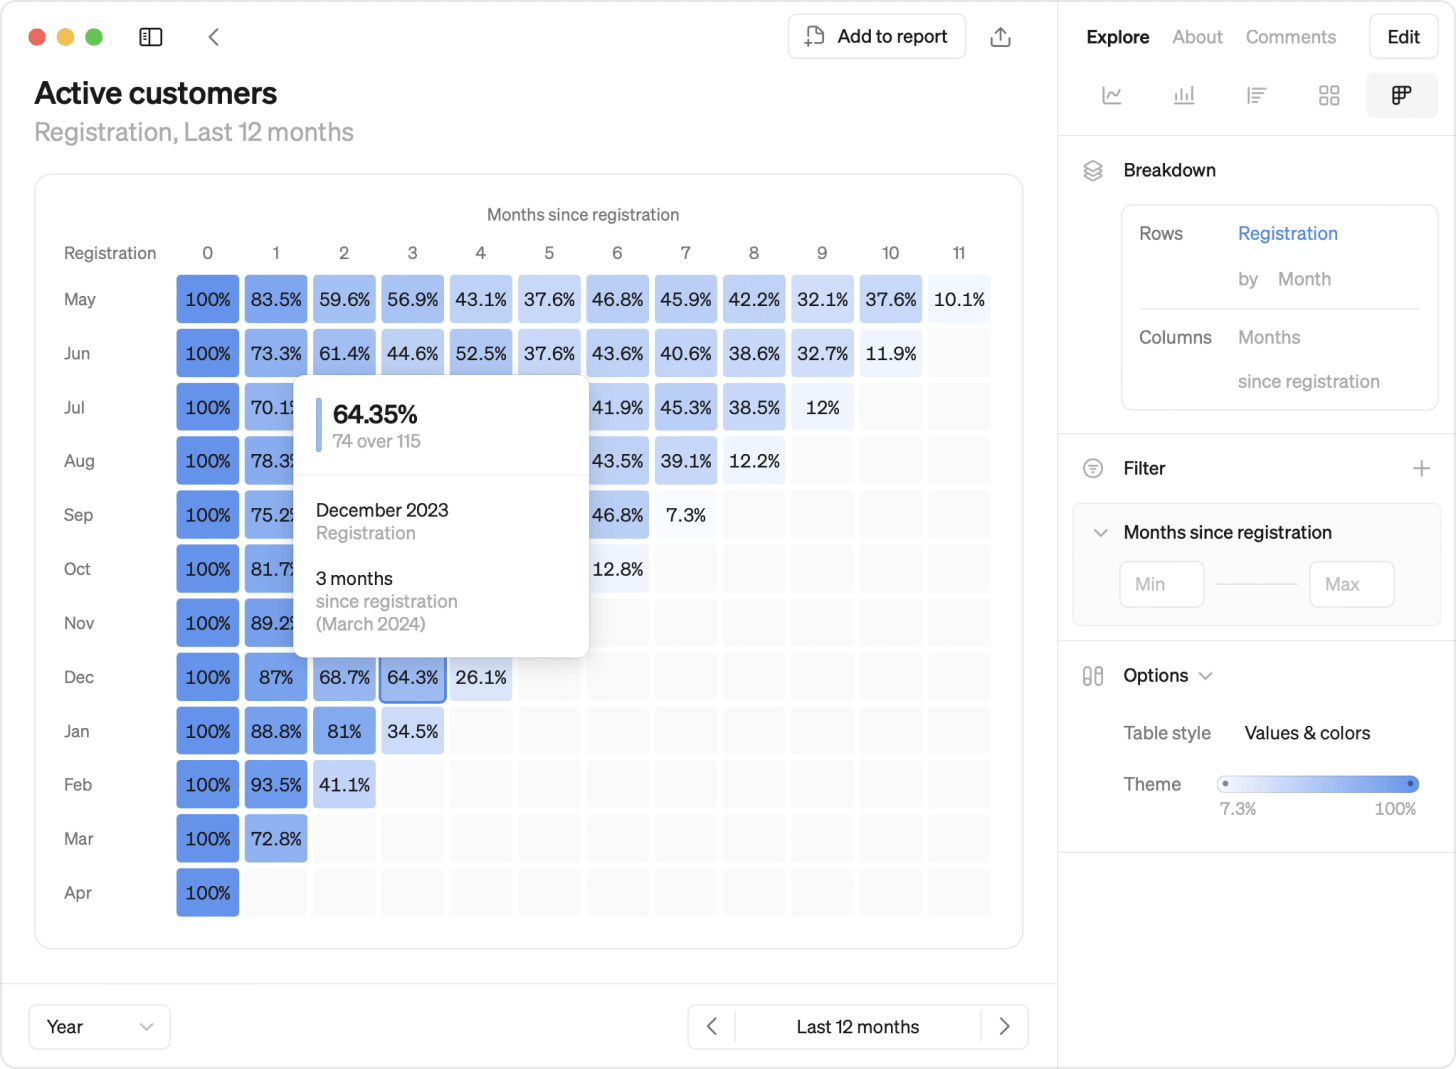
How to read a cohorts table
- Row by row - Each row gives you insights into the behavior of user groups over time. For instance, you can see how long different user groups remain active and at what point you start to lose them.
- Comparing rows - Comparing rows gives insights about your product's lifetime. You can compare the behavior of user groups who began using your product early with those who started recently. This can give you insights on things like product updates or marketing efforts.
- Diagonals - Any diagonal pattern in your cohorts table can provide insights into seasonality or indicate that something significant happened at a specific time. This is because calendar periods, for example 'May', will always be represented diagonally in a cohorts table.
Breakdown
Choose how to break down your cohorts, grouping user cohorts by a start date or a dimension. You can also adjust the granularity of both rows and columns.
Filters
Your cohorts table can be filtered like any other visualization.
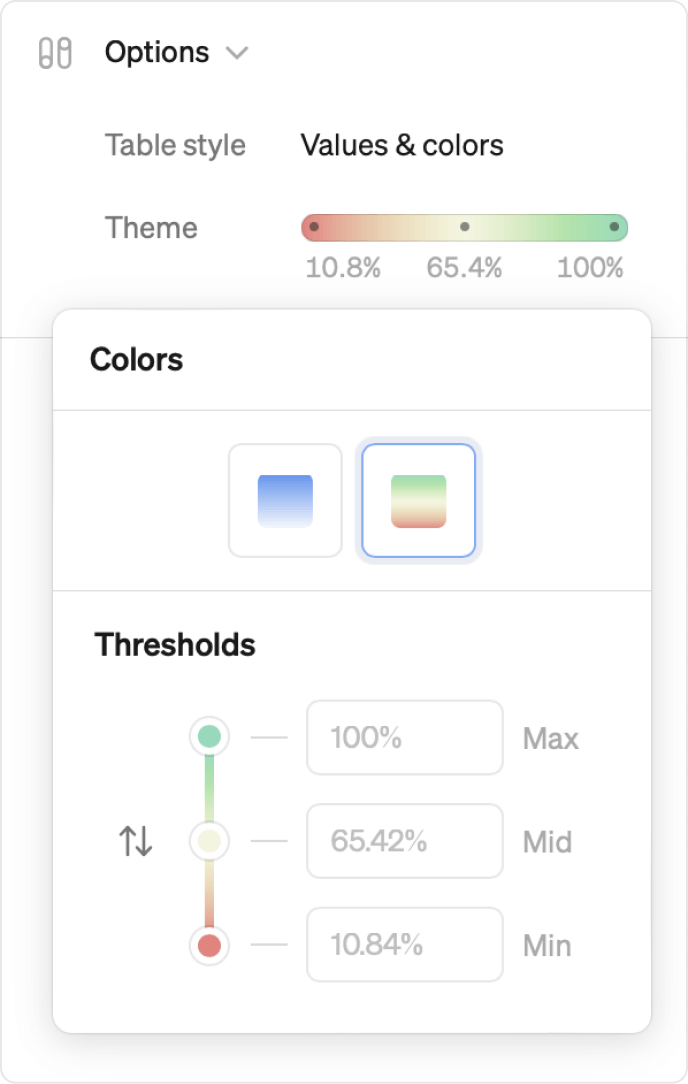
Colors
Select a color theme and customize color thresholds to find patterns or highlight insights within your cohorts table. Pick from seven monochrome and five multi-color schemes.
Monochrome:
- Blue
- Pink
- Green
- Yellow
- Purple
- Red
Multi-color:
- Traffic lights (red-yellow-green)
- Viridis
- Magma
- Red-blue
- Cyclic blue
Defining cohorts
To add cohorts to a metric, use the Cohorts section in the metric definition. As a workspace administrator, navigate to the metric and select 'Edit'. Once defined, cohorts are visualized as a table.
There are two ways of defining cohorts in Steep:
- Standard cohorts – Easily define cohorts from your existing tables, dynamically calculated for quick insights. No adjustments to your data structure required.
- Advanced cohorts – Built from tables explicitly created for cohorts, supporting more complex analyses like advanced retention cohorts.
Admins only
Only workspace administrators can define cohorts
Standard cohorts
Standard cohorts are defined from general detailed tables, for example orders or transactions, and dynamically calculated. They are flexible and provide a great option for most basic use cases.
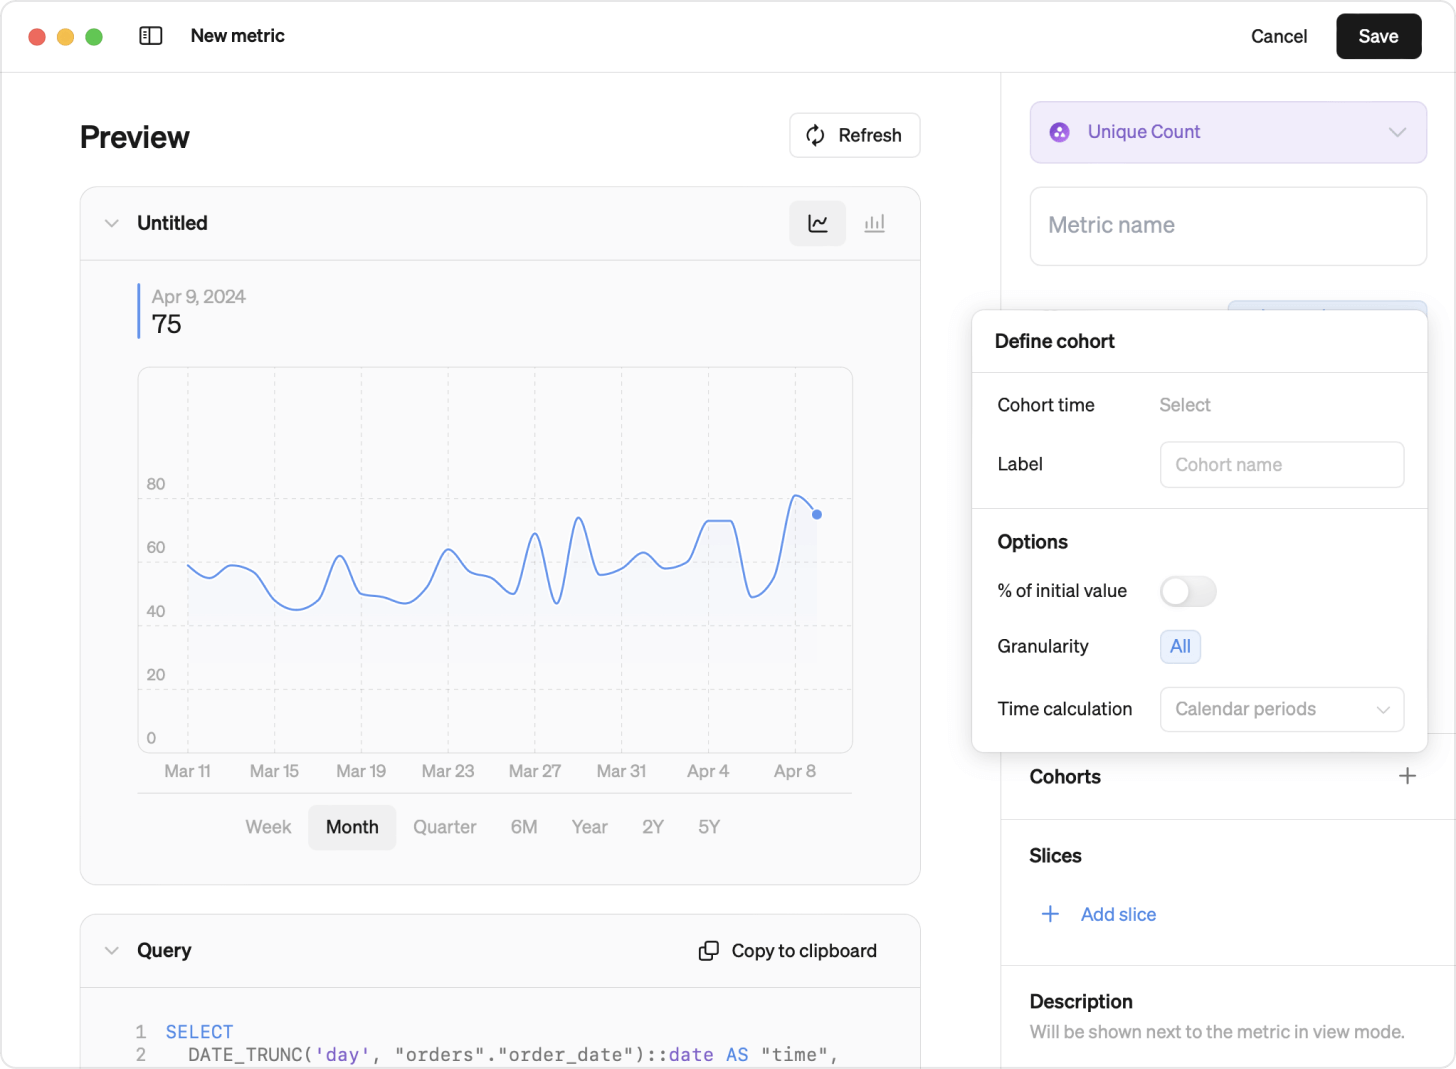
Setting up a standard cohort
- Define your metric basics and add Cohorts using the + button
- Choose a Cohort time - this defines how cohorts will be grouped
- Label your cohorts
- Decide if you want to break down by calendar period or rolling period (e.g., 7, 30, 90, or 365 days).
- Let the % of initial value be toggled off (this is used for standard retention cohorts)
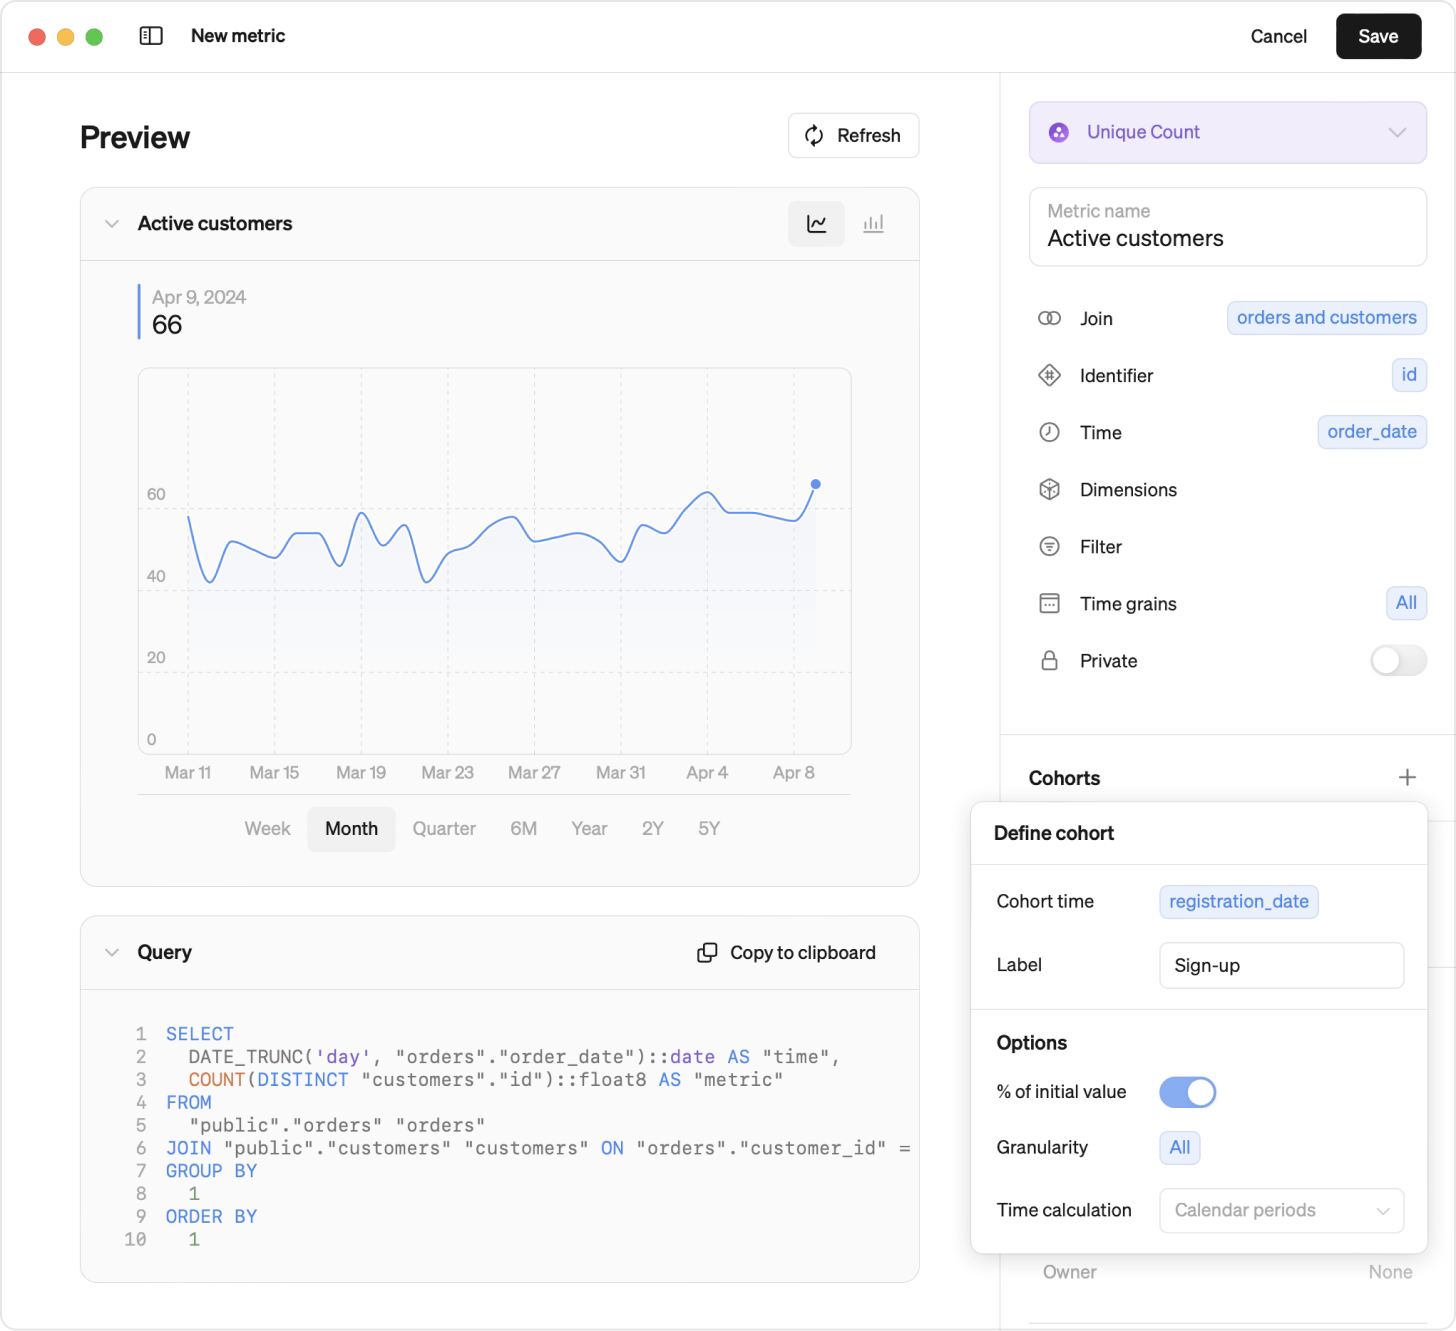
Setting up a standard retention cohort
- Set it up like a standard cohort. Use a join if necessary. How to create joins in Steep
- Toggle on % of initial value to create a breakdown where the current value for each column is divided by the cohort's initial value.
Standard retention cohort example
Suppose you want to measure retention by customers with orders by setting up a metric for Active customers based on a join by the tables customers and orders. An active customer is defined as a customer with orders. We set the cohort time to be registration_date to create user cohorts grouped by the date of the registration.
By enabling % of initial value , the cohort breakdown will show:
Current value (customers with orders this period) / Initial value (customers with orders in period 0) = Retention rate.
Example: Data tables
Table: customers
| id | registration_date | country | ... |
|---|---|---|---|
| abc123 | 2024-01-01 | SE | ... |
| abc124 | 2024-01-02 | FR | ... |
Table: orders
| customer_id | order_date | amount | ... |
|---|---|---|---|
| abc123 | 2024-03-01 | 100 | ... |
| abc 123 | 2024-04-05 | 100 | ... |
Example: Define a standard retention metric
Example: Explore a standard retention metric
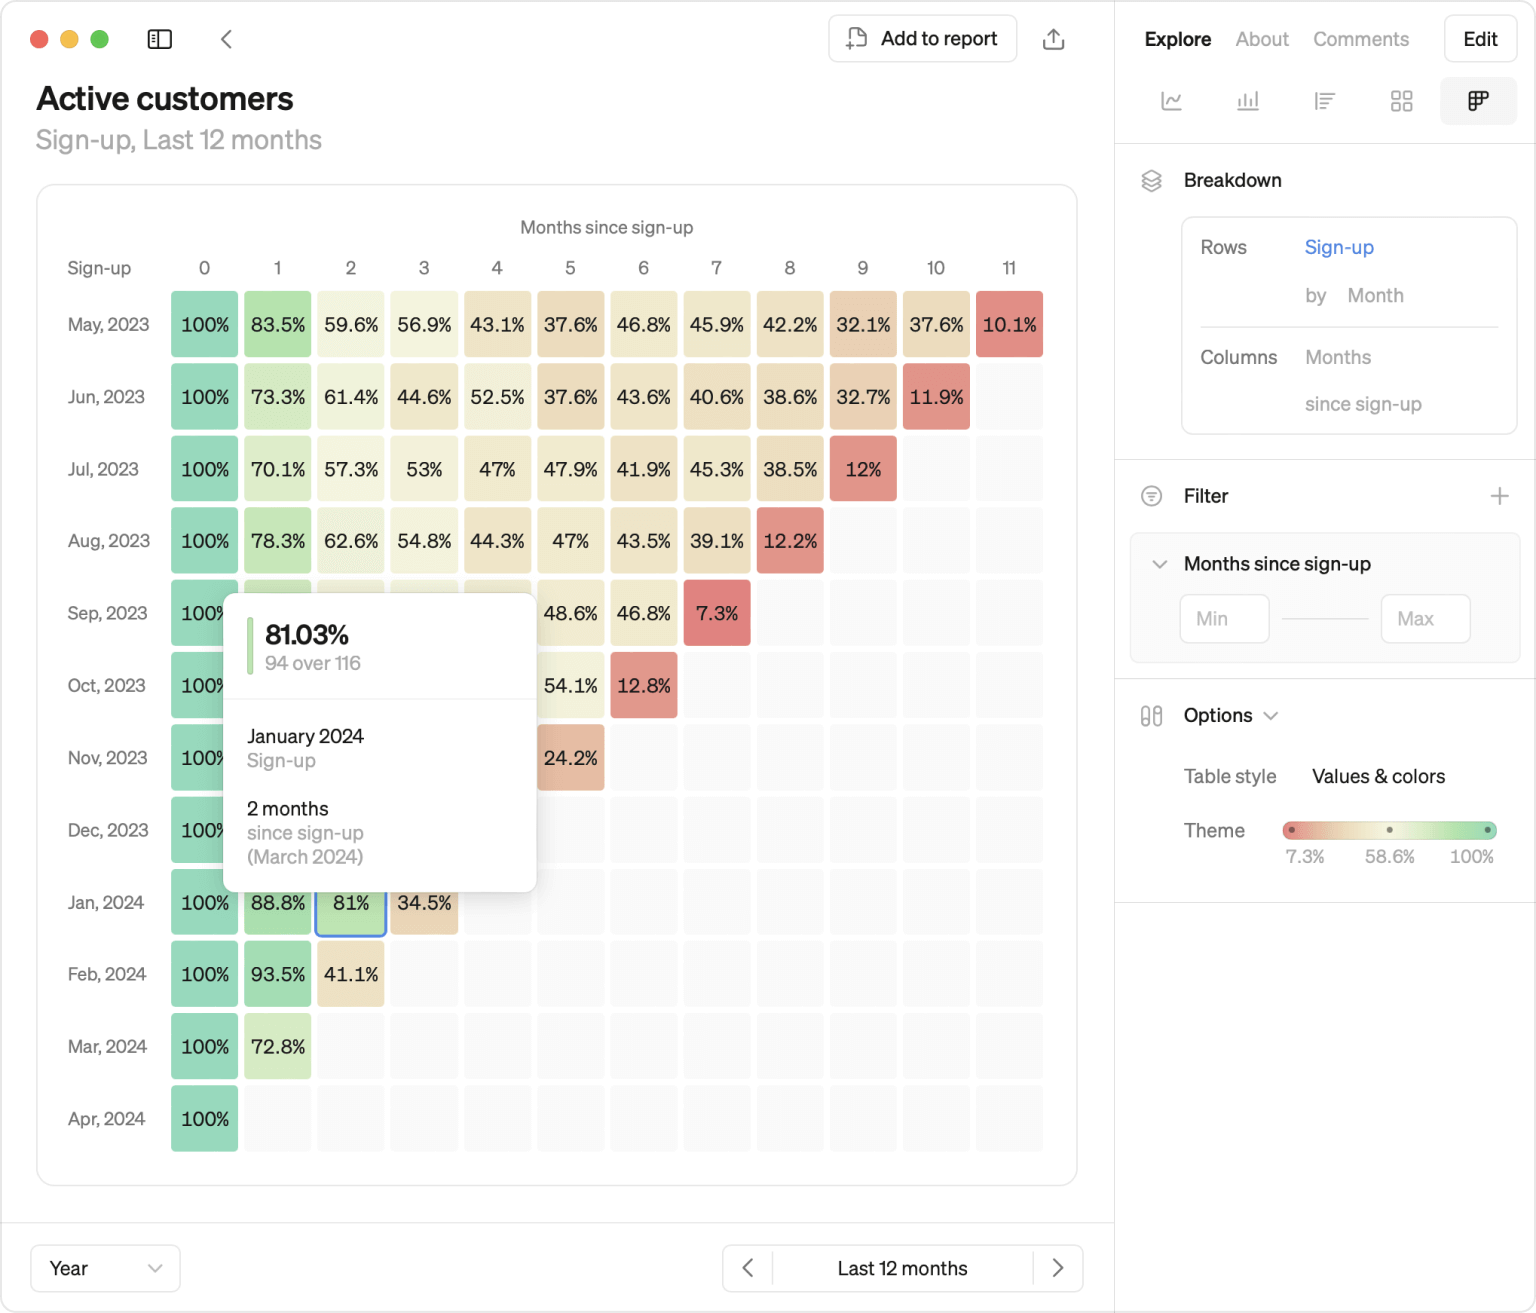
Dimensions
Any defined dimension can be used to group cohorts.
Rolling period or calendar period
By default your cohorts table will breakdown your cohort over calendar periods, but you can choose to change this to rolling periods (7, 30, 90 or 365 days)
Granularity
For standard cohorts, all workspace members can automatically explore all granularities of the cohort table, for both rows and columns. If needed, it is possible to limit the granularity options, for the cohort table, in the metric definition.
Adjusting the granularity will impact both the rows and columns.
Please note
The rows in the cohorts tables (cohorts) will be determined by the cohorts’ granularity. The columns in the cohorts table (breakdown over time) will be determined by the overlap of time grains between the metric time grain and the cohorts’ granularity.
Cohort only
Enable the Cohorts Only option for metrics that are only used for cohort analysis. An example of this could be a user retention metric. This option disables all other visualization types (line, bar, rank and pivot table) for the metric.
Advanced cohorts
Advanced cohorts are built from a pre-aggregated table created specifically for the cohorts you want to set up. They offer less flexibility but support more advanced use cases, such as more advanced retention cohorts.
Advanced cohorts granularity
Decide on one specific granularity when pre-aggregating a cohorts table, for example daily or monthly. Use the Granularity option to set Steep cohort definition to the same granularity. Adjusting the granularity will impact both the rows and columns of your cohorts table.
Please note
The rows in the cohorts tables (cohorts) will be determined by the cohorts’ granularity. The columns in the cohorts table (breakdown over time) will be determined by the overlap of time grains between the metric time grain and the cohorts’ granularity.
Setting up advanced retention cohorts
- Prepare a new cohorts table by combining data from other tables and pre-calculating cohorts values. You have full control over how to calculate your numbers; for example, you can make them cumulative or remove deleted accounts from the relevant periods, among other options.
- Define your metric in Steep by referencing columns in your prepared cohorts table.
- Define what granularity your prepared data is stored in.
Advanced retention cohort example
You could create an advanced retention cohort for orders by pre-aggregating numbers from the users and orders tables. This allows us to group user cohorts based on when the user was created, and also include users that haven’t yet made their first order.
We set it up as a ratio metric and refer to the appropriate columns in our newly created cohorts table. The breakdown over time would be 'active users' divided by 'created users'. By pre-aggregating the data, we have full control and can, for example, remove deleted users from the time they were deleted, or decide to calculate cumulative numbers.
In this example the granularity is monthly
Advanced cohorts table (example)
Table: monthly_customer_retention
| customer_registration_date | order_month | no_of_ordering_customers | no_of_registered_customers |
|---|---|---|---|
| 2024-01-01 | 2024-01-01 | 116 | 118 |
| 2024-01-01 | 2024-02-01 | 103 | 118 |
| ... | ... | ... | ... |
| 2024-02-01 | 2024-02-01 | 107 | 109 |
Advanced retention cohorts definition (example)
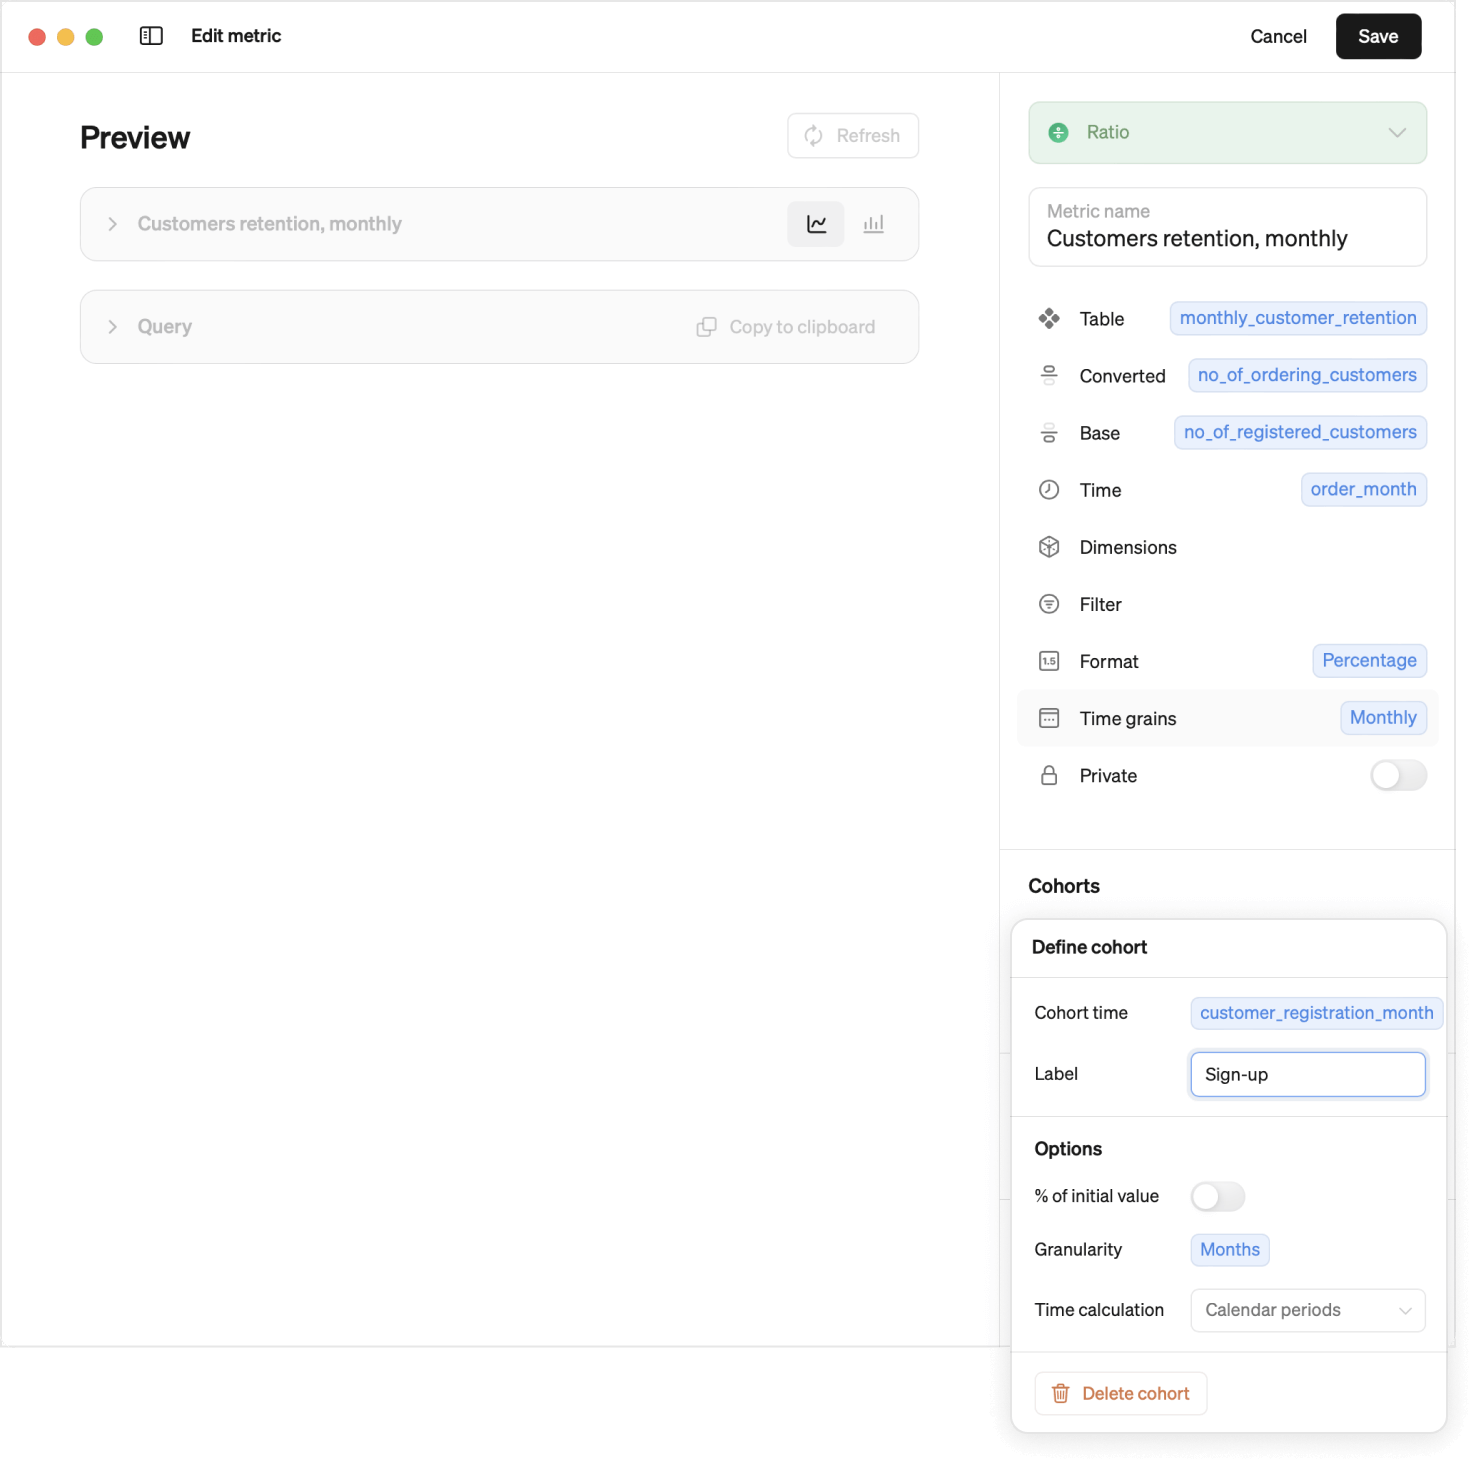
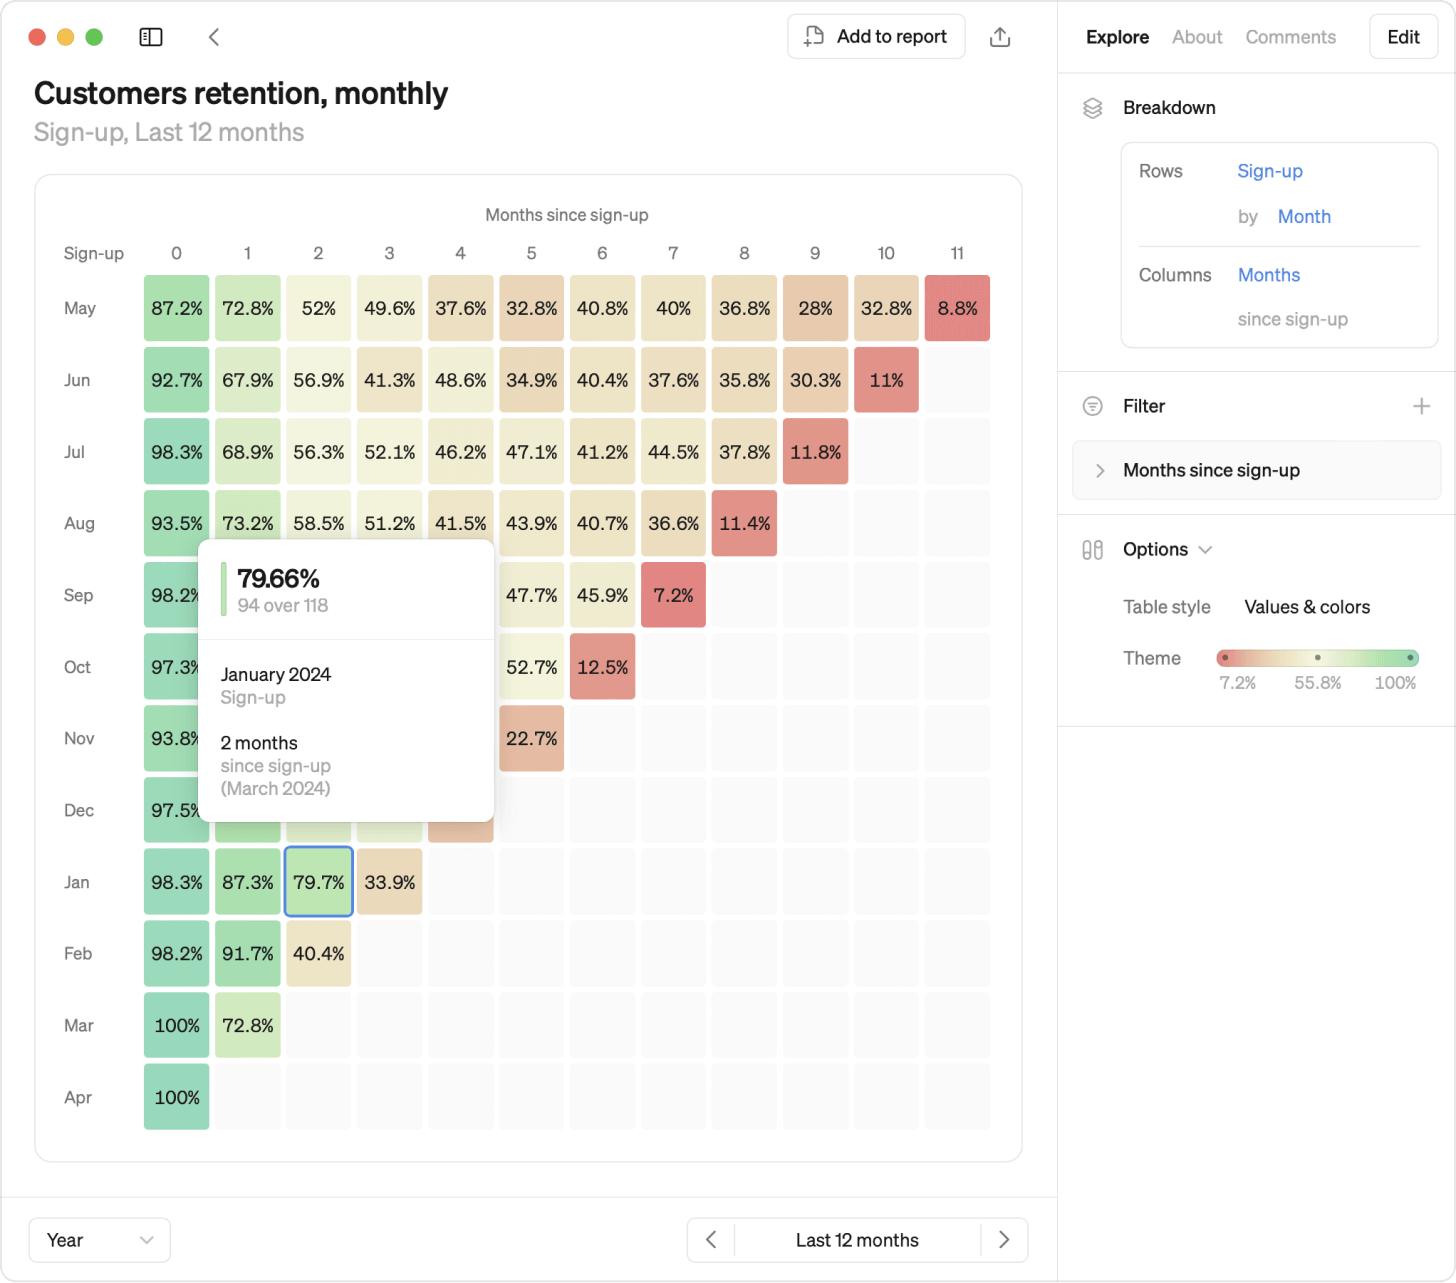
Explore the metric (example)
Cohorts only
Enable the Cohorts Only option for metrics that are only used for cohort analysis. An example of this could be a user retention metric. This option disables all other visualization types (line, bar, rank and pivot table) for the metric.
Data source support
Cohorts support in dbt cloud and Cube
Cohorts in metrics from a semantic layer integration is currently not supported.
Supported
Cohorts functionality is currently supported using any of the following data sources:
- Athena
- BigQuery
- Databricks
- PostgreSQL
- Redshift
- Snowflake
Not currently supported
The following data sources are currently not supported for defining cohorts:
- MySQL
- Microsoft SQL Server
- Synapse SQL