Previous target table format
We have updated our target table format to support targets with multiple dimensions applied at the same time. If you registered your targets table before March 2025, you may still be using the old target table format. We recommend updating the format to take advantage of the all the benefits. Read our migration guide to learn how to update to the new target table format.
How targets works
- Create a table in your database following the targets table format found below
- Connect your targets table to Steep.
- Add targets to line, bar, and rank charts and tables or display them in home and team screen widgets
- Apply filters
- Single filter applied → Shows the target for the selected dimension.
- Multiple filters applied → Automatically adds up target values for the selected dimensions.
This ensures that targets match the filtered data, making it easy to track progress toward goals without manual adjustments.
Targets are typically used for Budgets and Forecasts, and tied to specific metrics. You may add more than one target to each metric in your workspace.
Everyone
View targets
Admins
Set up targets
How to prepare your targets data
To set up targets in Steep, register a target table from your database. Steep will read targets from this table and match them to the corresponding metric. The target table needs to follow the formatting outlined below.
Target table format
| series | metric | time | dimension identifier | value | numerator | denominator |
|---|---|---|---|---|---|---|
| series name | metric_identifier | start date | dimension value | target value | ratio numerator | ratio denominator |
Target table columns:
Series: The series column can be used to set up multiple targets per metric, e.g. ”Budget”, ”Budget v2”, ”Stretch budget”, that users can switch between.
Time: The time column specifies the start date of each period based on the time grain (for example 2022-04-01 for April on a monthly time grain, or 2022-04-04 for Week of Apr 4 on a weekly time grain). Steep automatically detects the time grain of your target series by looking at the difference between the first two dates in each series.
Metric: The metric column should refer to metrics via their identifiers.
Dimension: The dimension column(s)is used to specify the dimension and dimension values. A metric can have multiple dimensions, and the column name must match the column name of the dimension in your database. Add the corresponding dimension values in the table. If targets are not set at the dimension level, you can exclude the dimension columns. Specify the dimension value for a metric, or a combination of dimension values.
Note
You must add target values for all combinations of dimension values to get aggregations of targets in visualizations. See the example table below.
Value: The value column represents the target value for the specific metric and applied dimensions for the specified time.
Ratio metrics: If you are adding a target to a ratio metric you need to include numerator and denominator columns. Add the numerator and denominator that is used to generate the target value. The target ratio will automatically appear as either a number or percentage, depending on how the metric is defined.
Note
In the target table, any columns that begin with an underscore (_) will be ignored during processing. These columns can still be added for internal purposes, such as metadata.
Target table examples:
Basic example
| series | metric | time | value |
|---|---|---|---|
| Budget 2024 | new_users | 2024-01-01 | 10000 |
| Budget 2024 | new_users | 2024-04-01 | 12000 |
| Budget 2024 | new_users | 2024-07-01 | 15000 |
| Budget 2024 | new_users | 2024-10-01 | 20000 |
Complex example
| series | metric | time | country | platform | value | numerator | denominator |
|---|---|---|---|---|---|---|---|
| Budget 2025 | new_users | 2025-01-01 | null | null | 1000 | null | null |
| Budget 2025 | new_users | 2025-02-01 | null | null | 1500 | null | null |
| Budget 2025 | new_users | 2025-01-01 | null | iOS | 500 | null | null |
| Budget 2025 | new_users | 2025-02-01 | null | iOS | 700 | null | null |
| Budget 2025 | new_users | 2025-01-01 | US | null | 500 | null | null |
| Budget 2025 | new_users | 2025-02-01 | US | null | 600 | null | null |
| Budget 2025 | new_users | 2025-01-01 | US | iOS | 250 | null | null |
| Budget 2025 | new_users | 2025-02-01 | US | iOS | 300 | null | null |
| Budget 2025 | activation_rate | 2025-01-01 | US | null | null | 10 | 100 |
| Budget 2025 | activation_rate | 2025-02-01 | US | null | null | 5 | 100 |
Aggregation and interpolation
Steep handles aggregation and interpolation of target values based on the metric template type. How values are calculated depends on whether you're aggregating across time or dimensions.
There are two resampling methods:
Sum/Divide: Adds values or divides them proportionally (e.g. summing daily values into weekly).
Average/Repeat: Averages values or repeats the same value across the time range.
The default method depends on the metric template type, but you can override it when creating or editing a metric.
Time aggregation
If your chart uses a different time grain than what’s defined in your target table (e.g. showing weekly data from daily targets), Steep automatically resamples the target values.
| Metric template type | Aggregation/Interpolation |
|---|---|
| Sum | Sum/Divide |
| Count | Sum/Divide |
| Unique count | Average/Repeat |
| Custom value | Sum/Divide |
| Ratio | Average/Repeat |
| Custom ratio | Average/Repeat |
| Derived ratio | Average/Repeat |
Dimensions
When you break down targets by dimensions other than time, Steep applies the following aggregation rules:
| Metric template type | Aggregation |
|---|---|
| Sum | Sum |
| Count | Sum |
| Unique count | Sum |
| Custom value | Sum |
| Ratio | Sum over sum |
| Custom ratio | Sum over sum |
| Derived ratio | Sum over sum |
Note
You must define your ratio, custom ratio or derived ratio targets using numerator and denominator columns, otherwise those values will not be aggregated over dimension columns according to the table above.
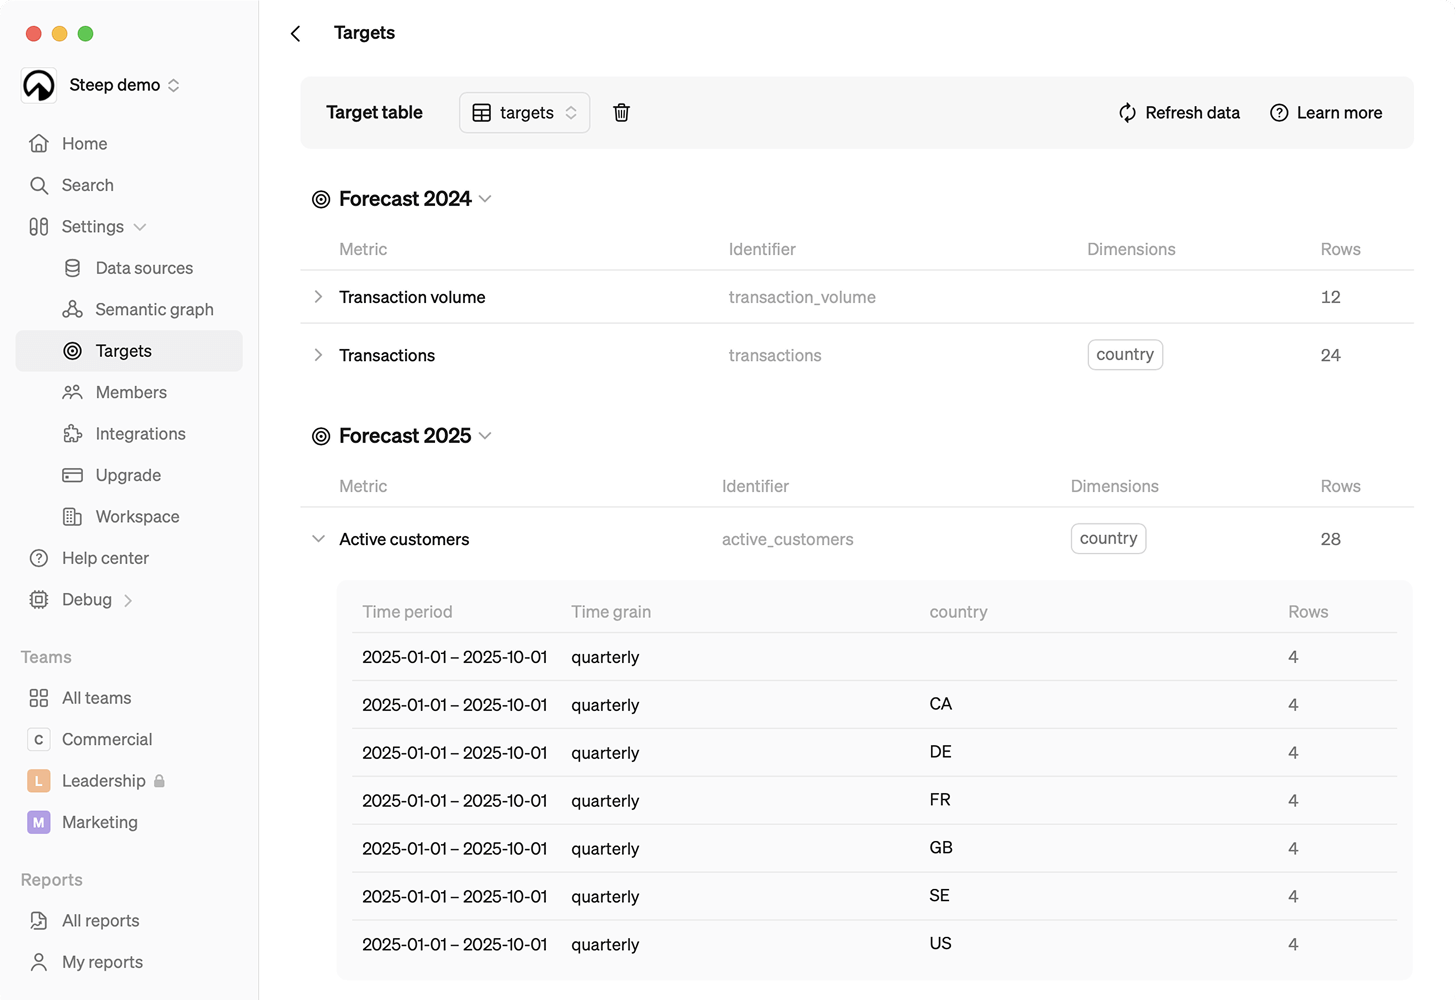
How to connect your targets table
To register your targets table in Steep, go to Model → Targets → select the targets table from your database.
Caching
Target data fetched from your targets table will be cached by Steep for 4 hour. In the rare case that you want to clear the cache after a major change to the source data, you can do that manually by changing your targets table setting eg. by removing it and adding it back.
How to add targets to visualizations
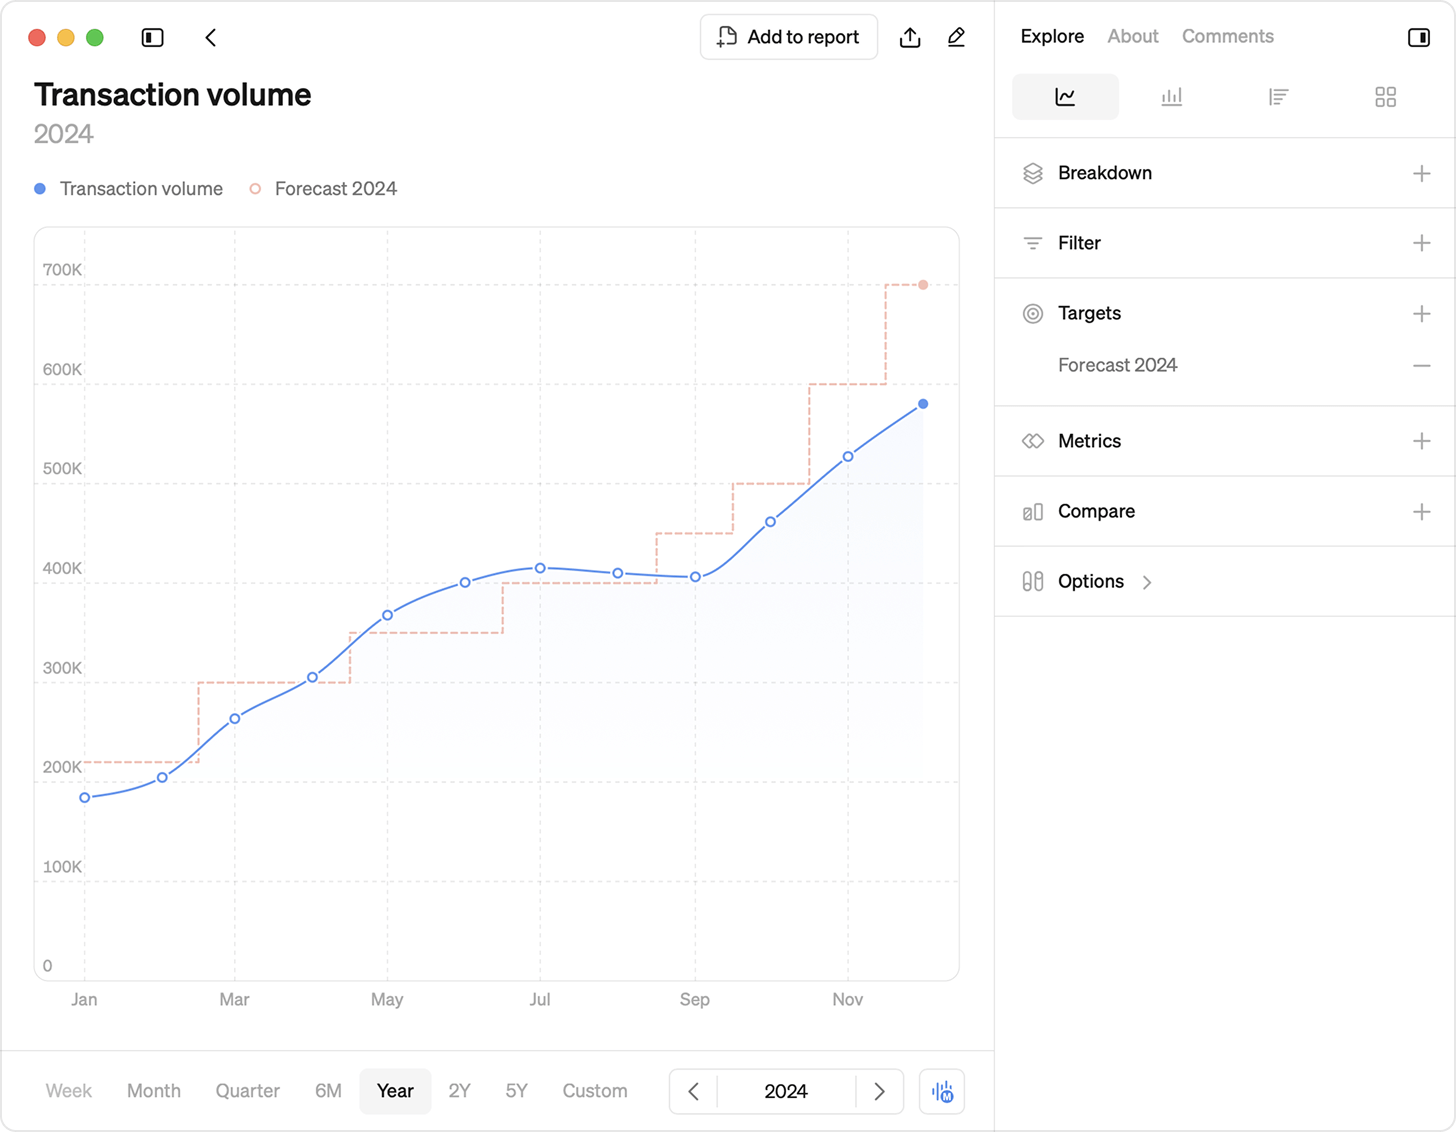
Metric charts
Add targets to metrics in the explore menu. The option to add a target appears in for all metrics with a matching metric identifier.
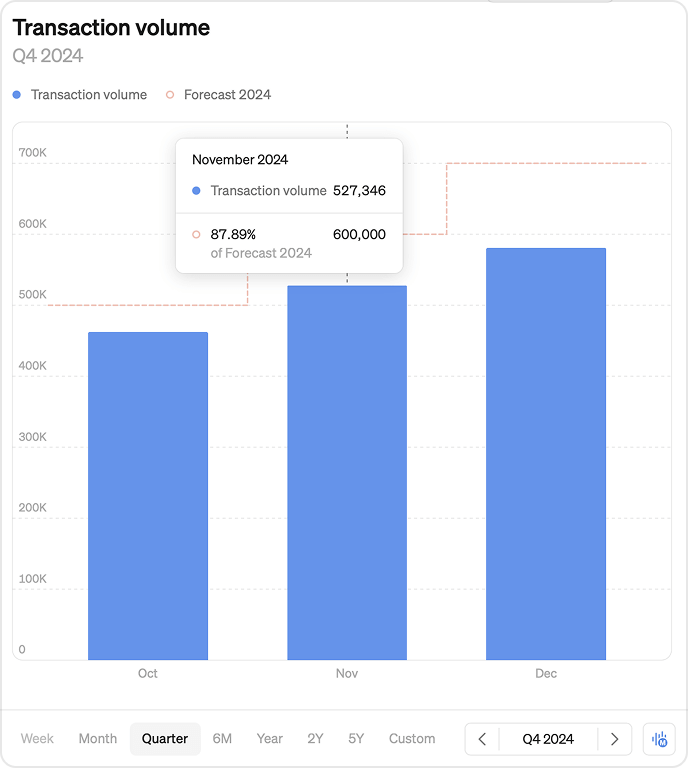
Widgets
Add a target to a widget to see how your metric performs directly on your home or team screen Learn how to add a Target to a widget.
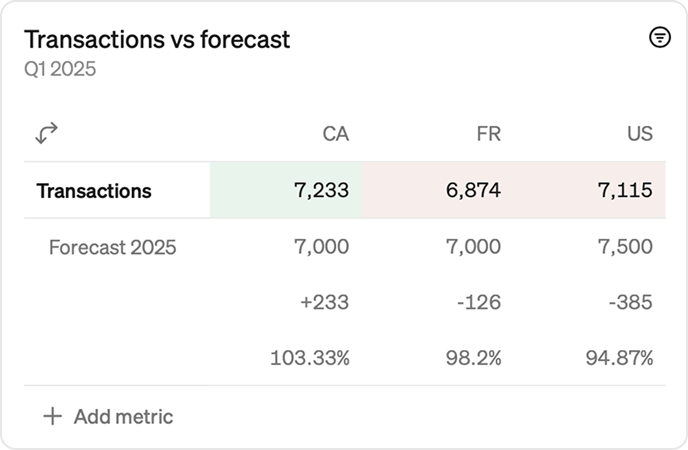
Tables
Add targets to your tables in reports. Click on the metric you want to add select the relevant target. The target will appear as a row under the metric.