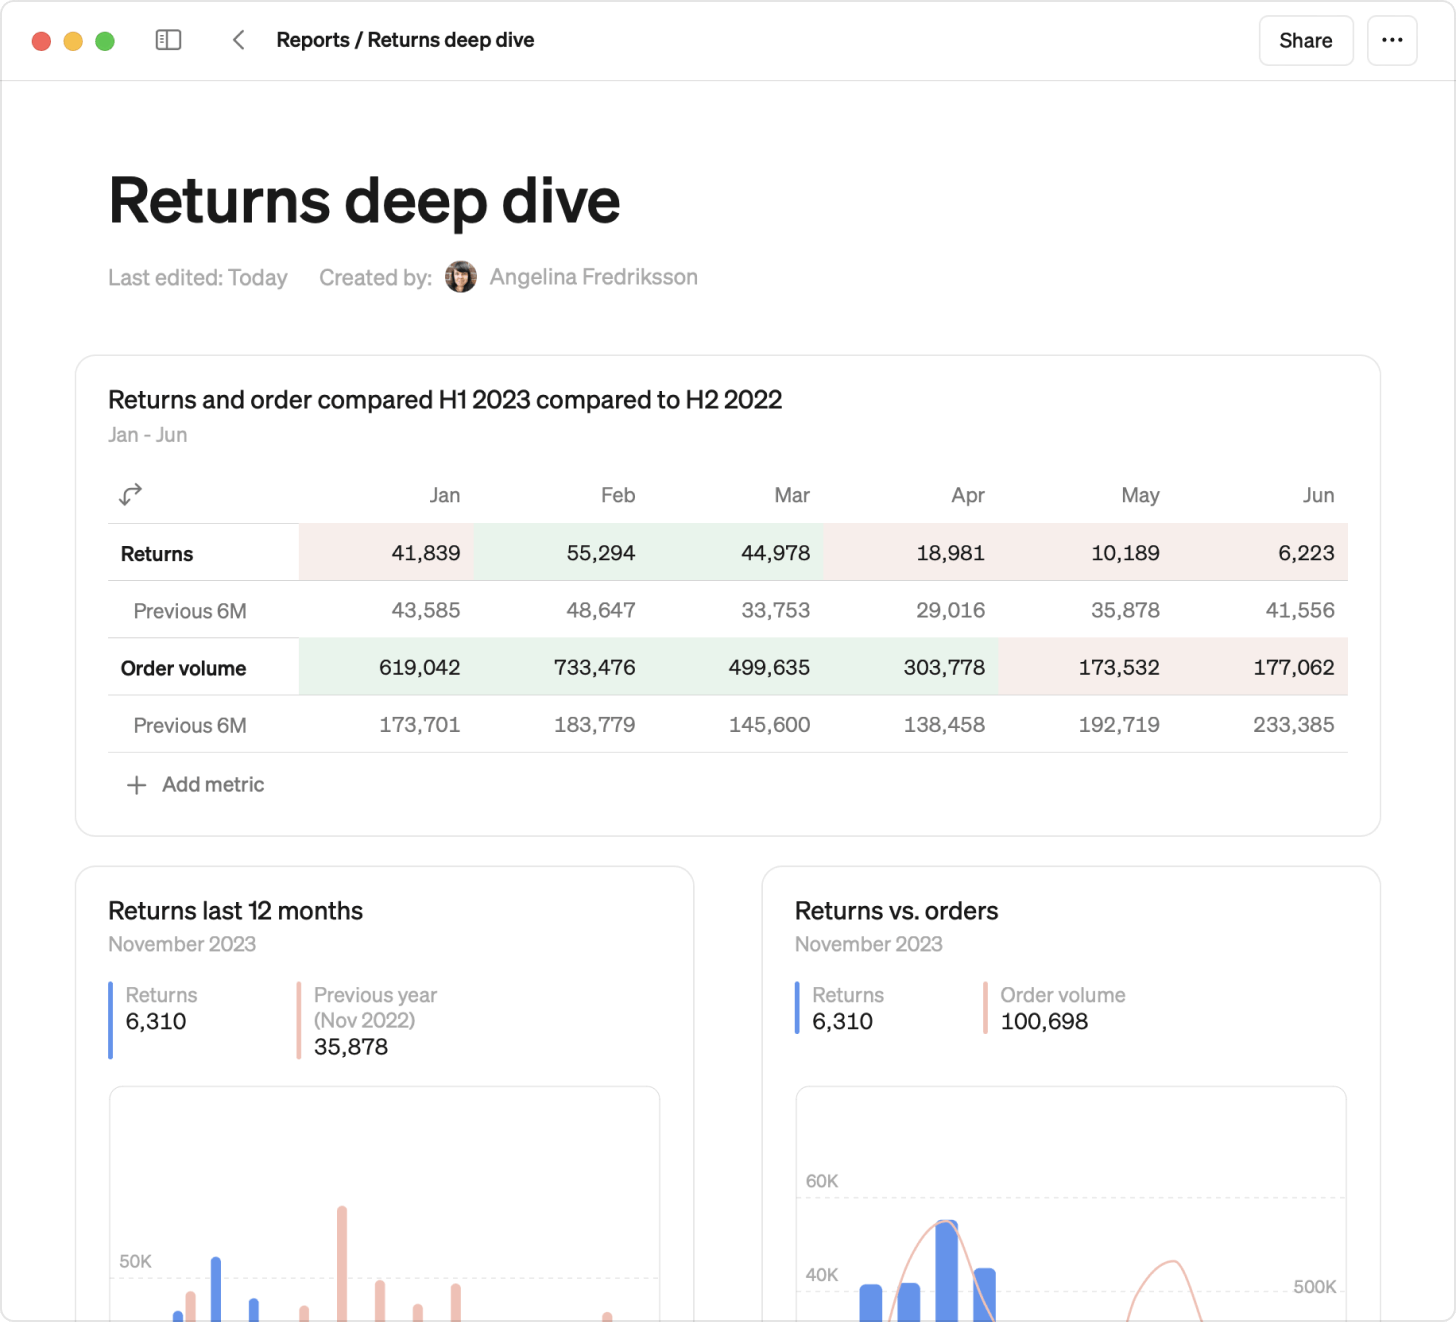
Communicate insights, collaborate seamlessly, and make sense of your data together. Use filters and flexible building blocks, like charts, tables, big numbers and text, to create any kind of page. All charts, and tables and big numbers are powered by metrics and are fast to add and edit.
No matter how you build your reports, they will always look great in the mobile app. No extra work required.
Everyone
Everyone can create reports. Reports can be kept private or shared with the workspace.
There are numerous ways to use reports. Here are a few example use cases to inspire you:
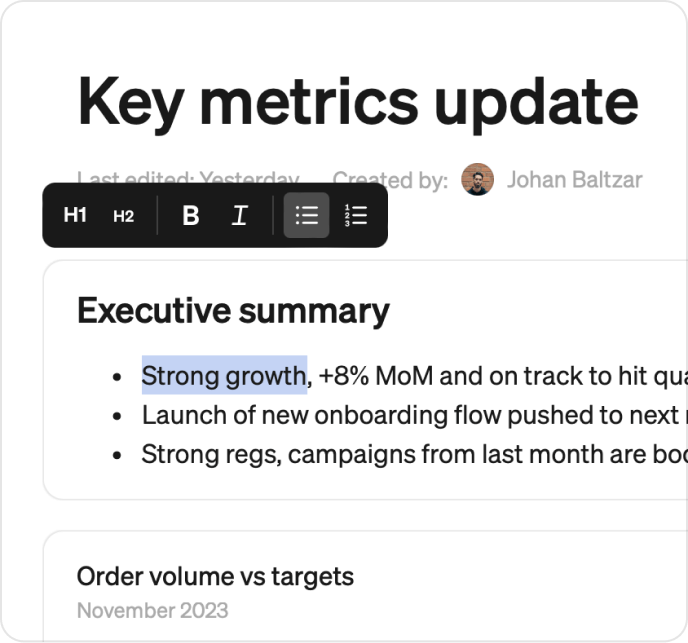
- Key metric update: Deliver the latest updates on your key metrics to your stakeholders. Next period, simply duplicate the report and update the time period.
- Deep dive analysis: Craft a well-structured analysis and walk readers through your findings. Visualizations are always easy to update.
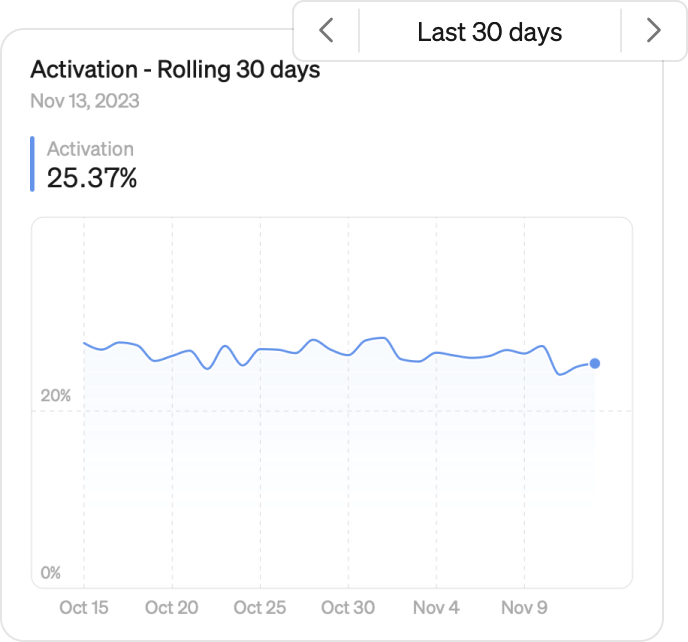
- Live tracker: The classic dashboard use case. Set time periods to rolling and add a set of charts to track important metrics vs. targets.
- Ad-hoc analysis: During meetings, open up Steep and collaborate with others to find answers to spontaneous questions. Allow everyone to contribute to the same report.
- Personal exploration: Investigate for yourself and save charts to a private report that you can iterate on before sharing with others.
Create new report
Go to the All reports page, and press Add report. Give your new report a title.
All reports
Charts
Add charts
All the ways to explore a metric can be saved as a chart in a report. You can add metric charts to your reports in two ways:
From a report
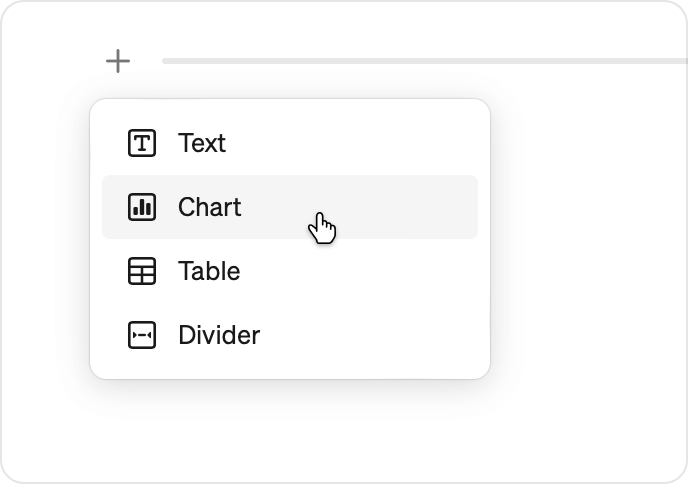
- Hover over the report to find the + button
- Click it and choose Chart
- Decide on a metric view to add
- Done
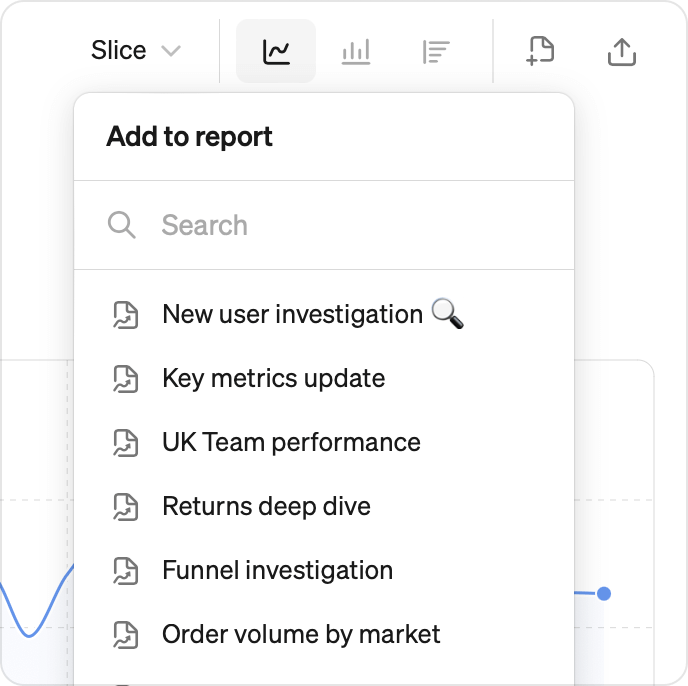
From a metric
- Go to a metric
- Select a preferred view of the metric
- Click Save to report
- Choose an existing report or create a new report
- Done
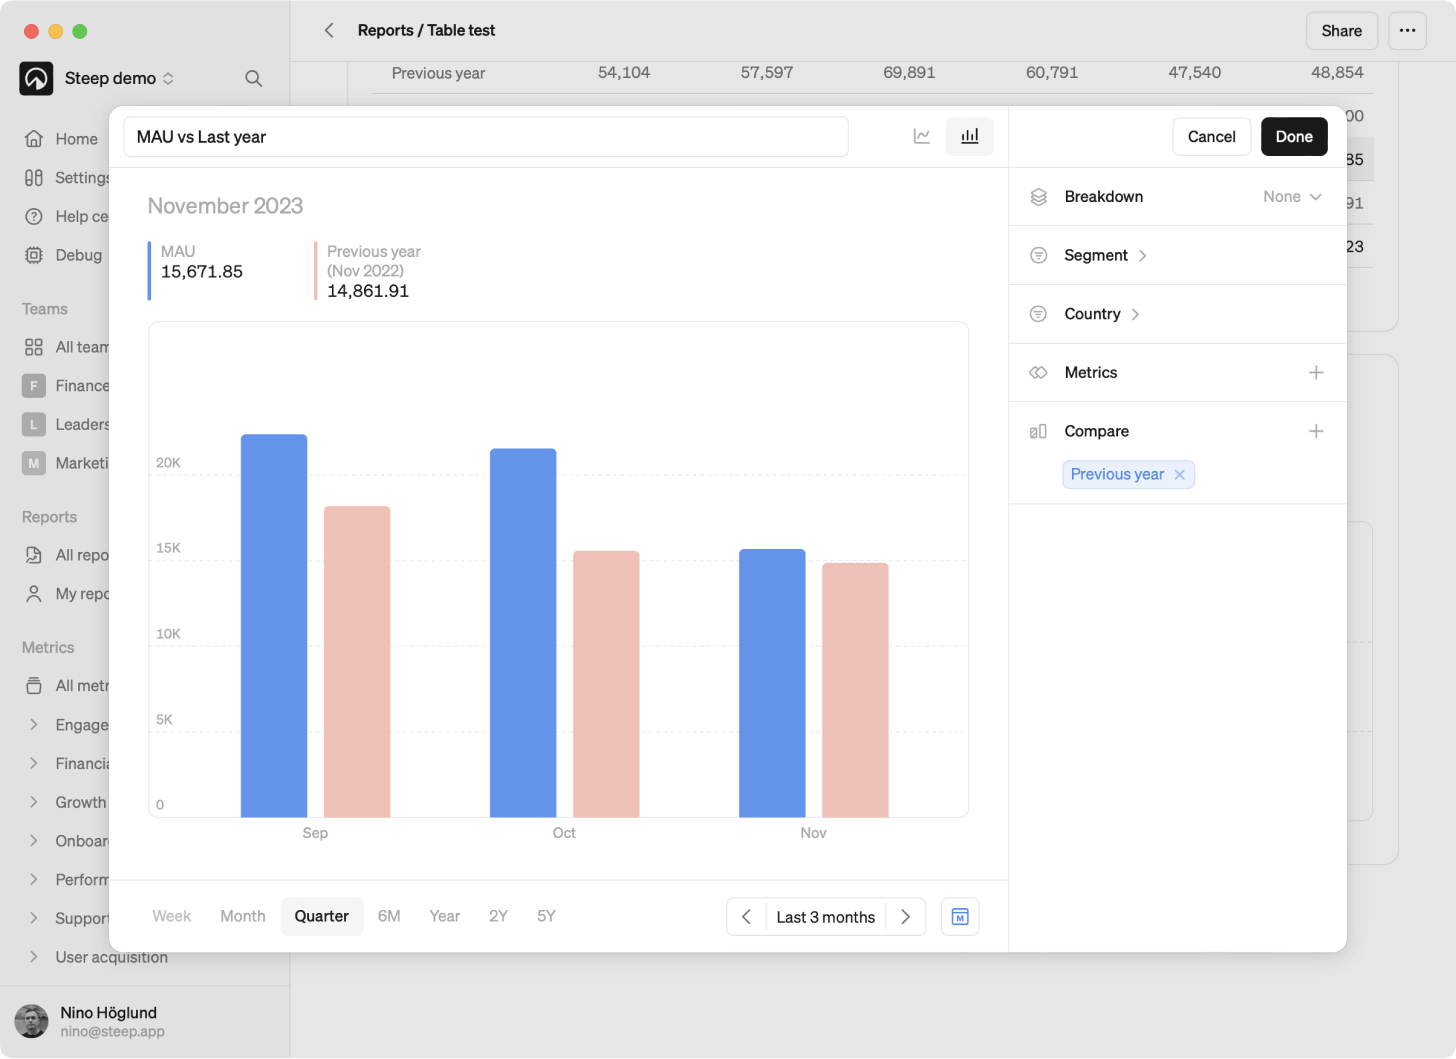
Edit chart
Hit the Edit-icon in the top right corner of a chart to edit. For example, you can change the time period, add a target or change the title. When you’re done the changes will immediately be saved for everyone.
For chart blocks using a rolling period on a daily time grain, you can also toggle Options > Include today.
Duplicate chart
Duplicate a chart from the top right corner of a chart.
Go to metric
Navigate to the metrics explore page from the top right corner of a chart.
Delete chart
Delete a chart from the top right corner of a chart.
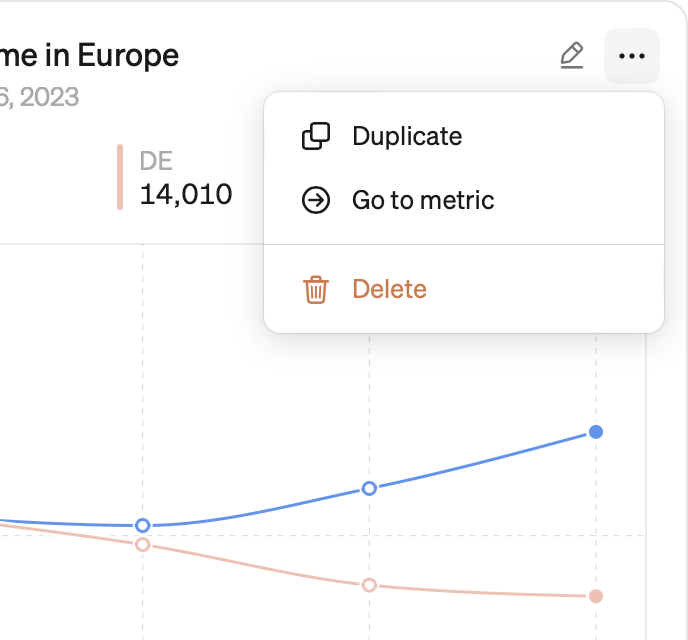
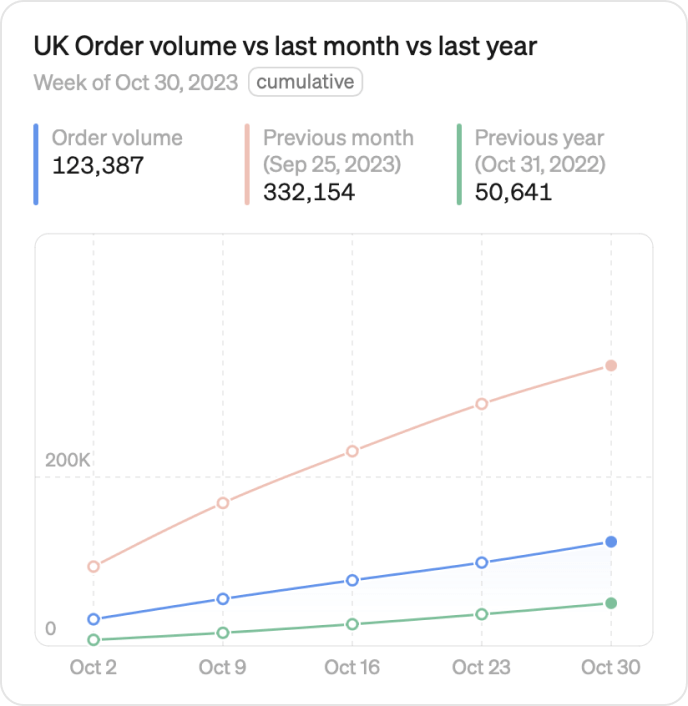
Chart examples
Tables
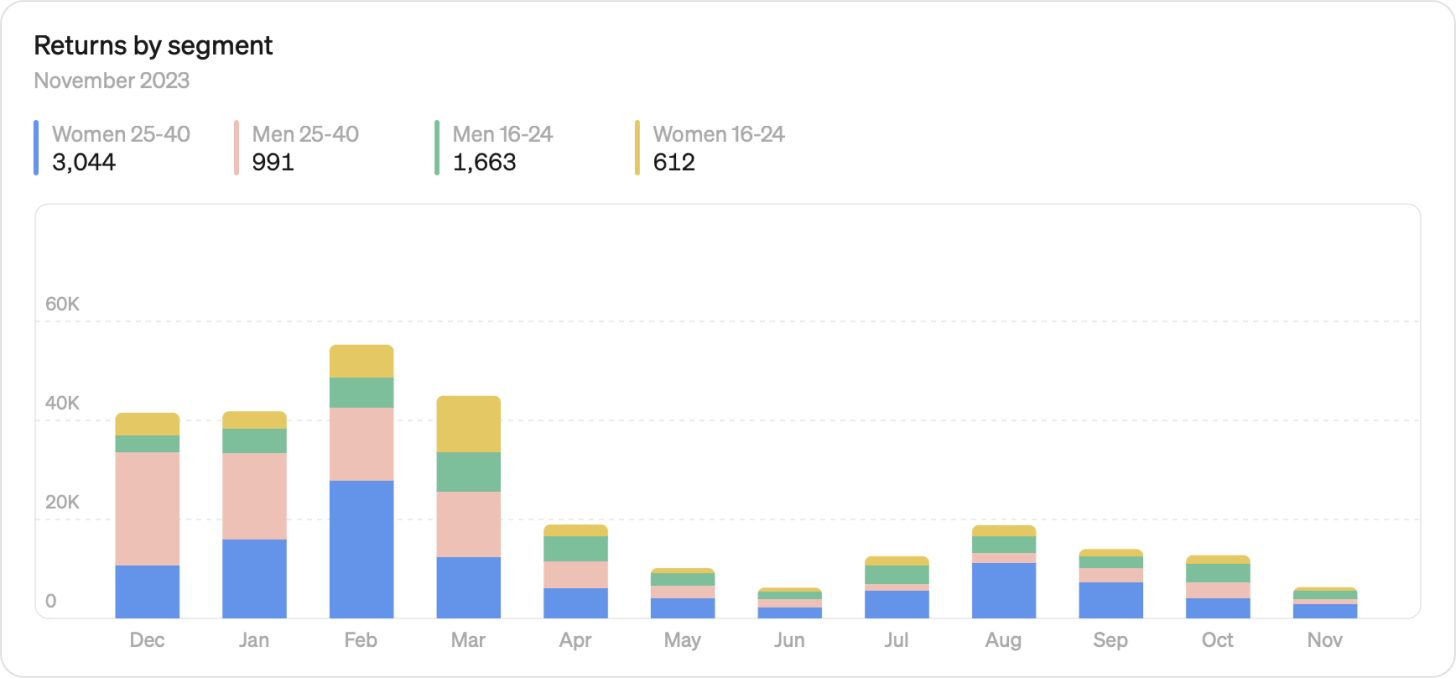
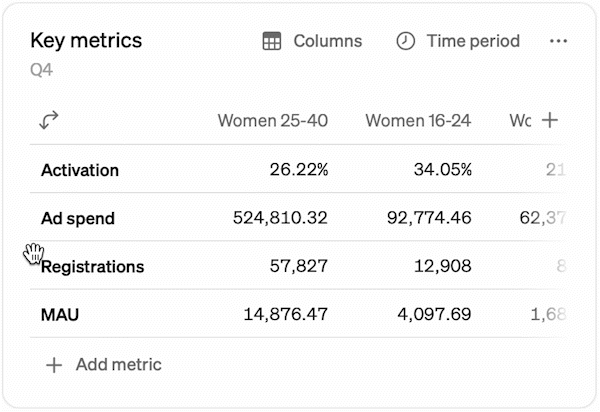
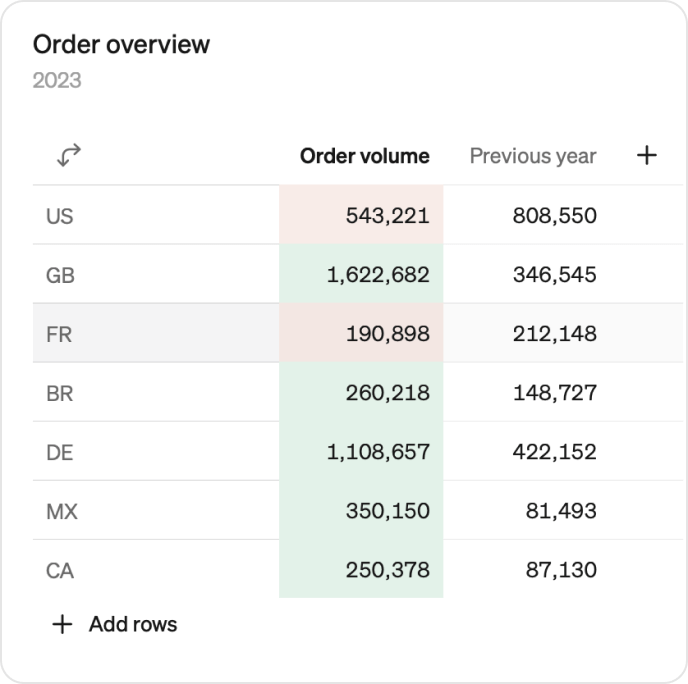
Tables are great for getting an overview of multiple metrics. Breaking down the data over time or a common dimension to quickly get a powerful view of the numbers.
Add tables
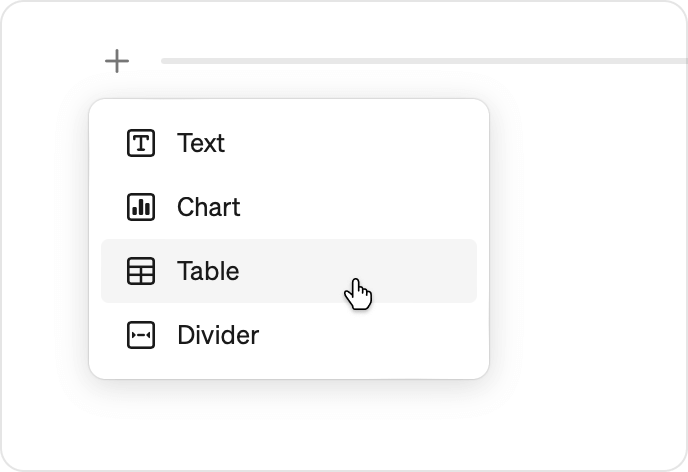
- Hover over the report to find the + button
- Click it and choose table
- A blank table is added to your report
- Directly on the table, add your metrics
- Add a title
- Done
Edit tables
Tables can be edited directly in reports.
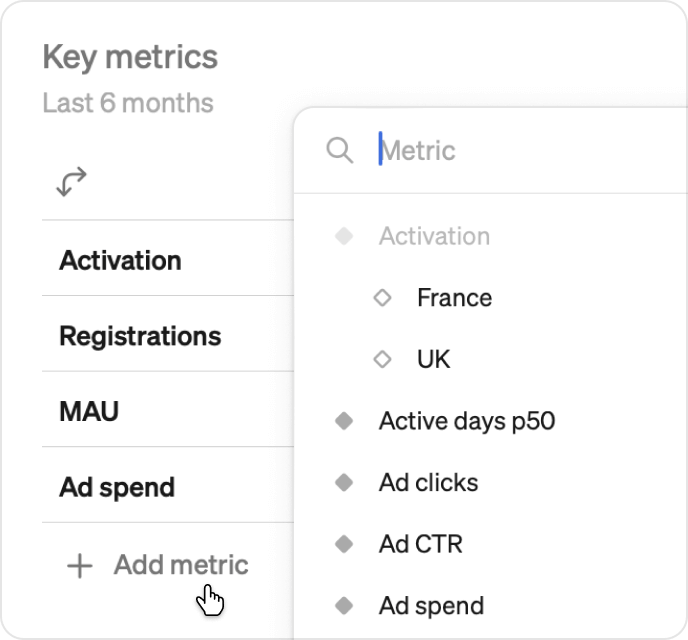
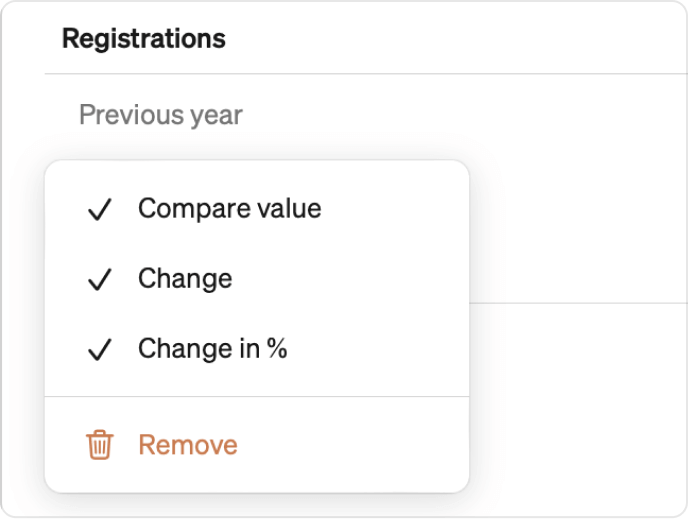
Adding and deleting metrics
Click on the + Add metric button to add metrics. To delete metrics from the table click on the metric and click Remove.
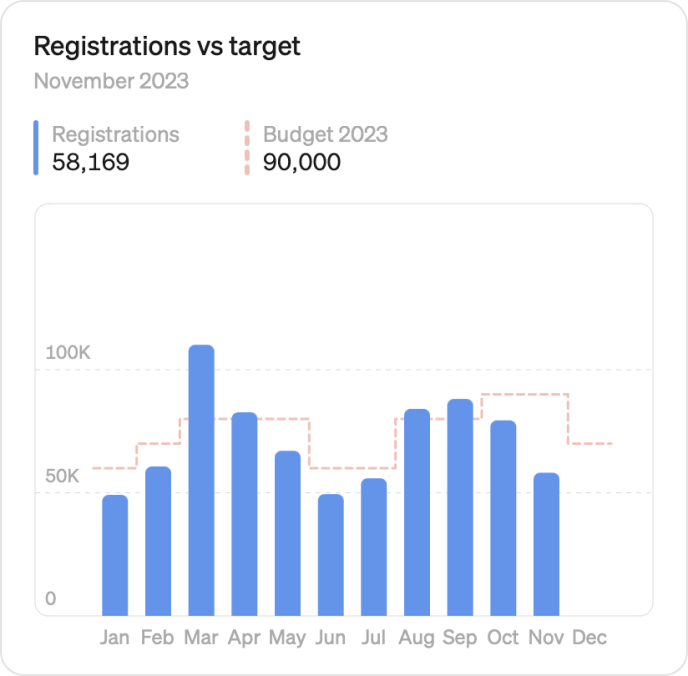
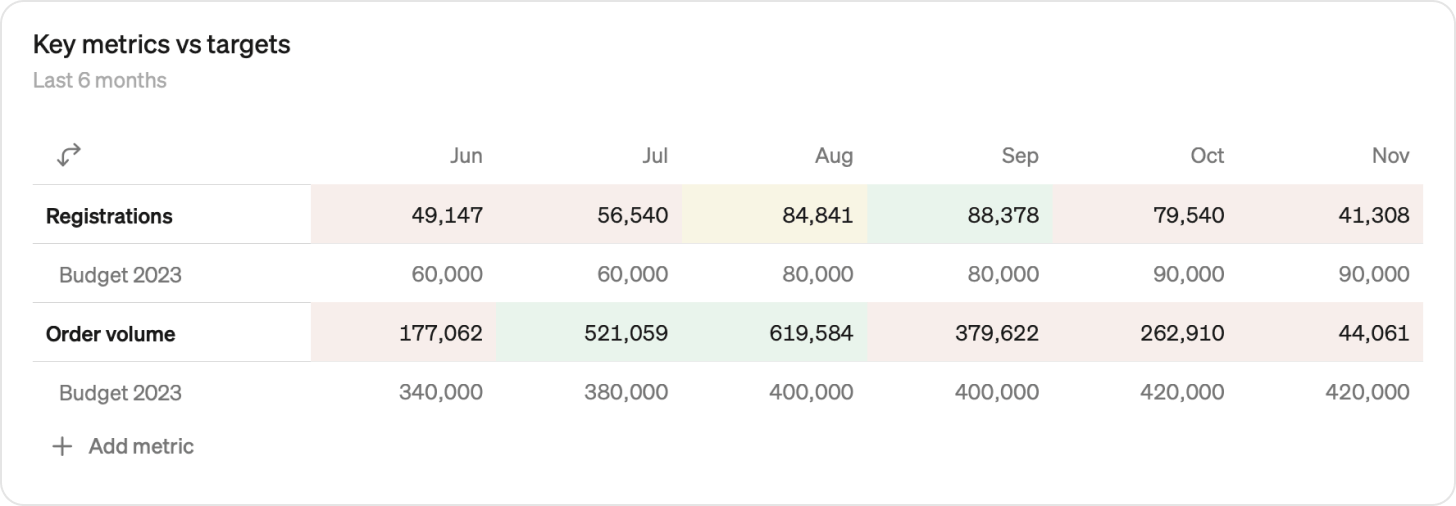
Targets
If your metric has targets associated with them, you can add those directly to the table.
Compare over time
For each metric you can compare to the previous period or previous year. For example, if your table shows the last month, you can compare each metric to the month before.
By default, the comparison shows values for the full prior period. To show values only up to the same point in the prior period — for example, comparing the first 15 days of this month to the first 15 days of last month — open Options in the edit panel and set Comparison period to To date.
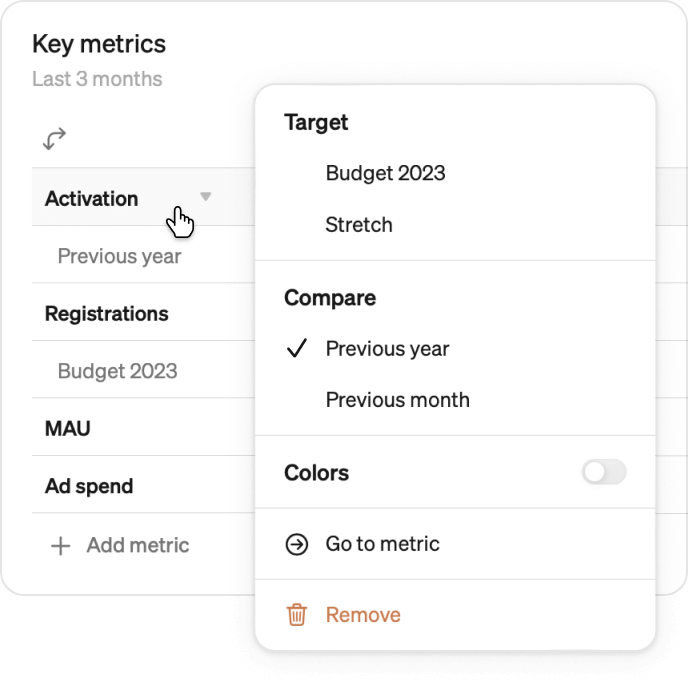
Change compared to metric
When you have added a target or compared to a previous time period click on the compare value to add the absolute and percentage change compared to the metric.
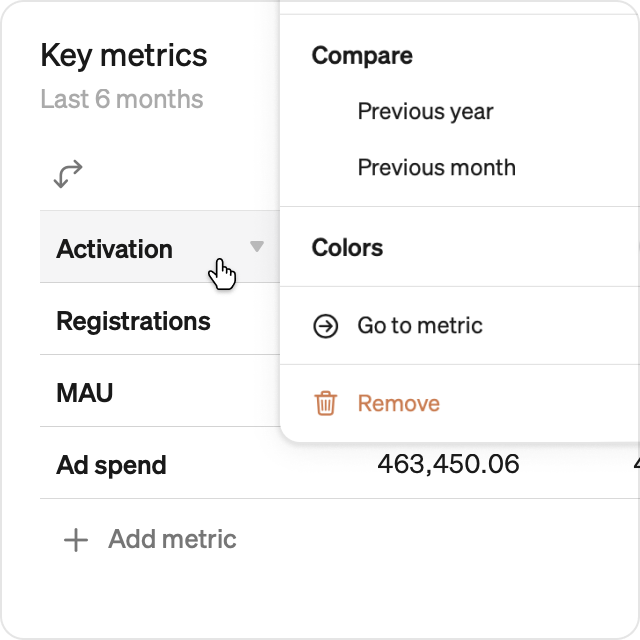
Colors
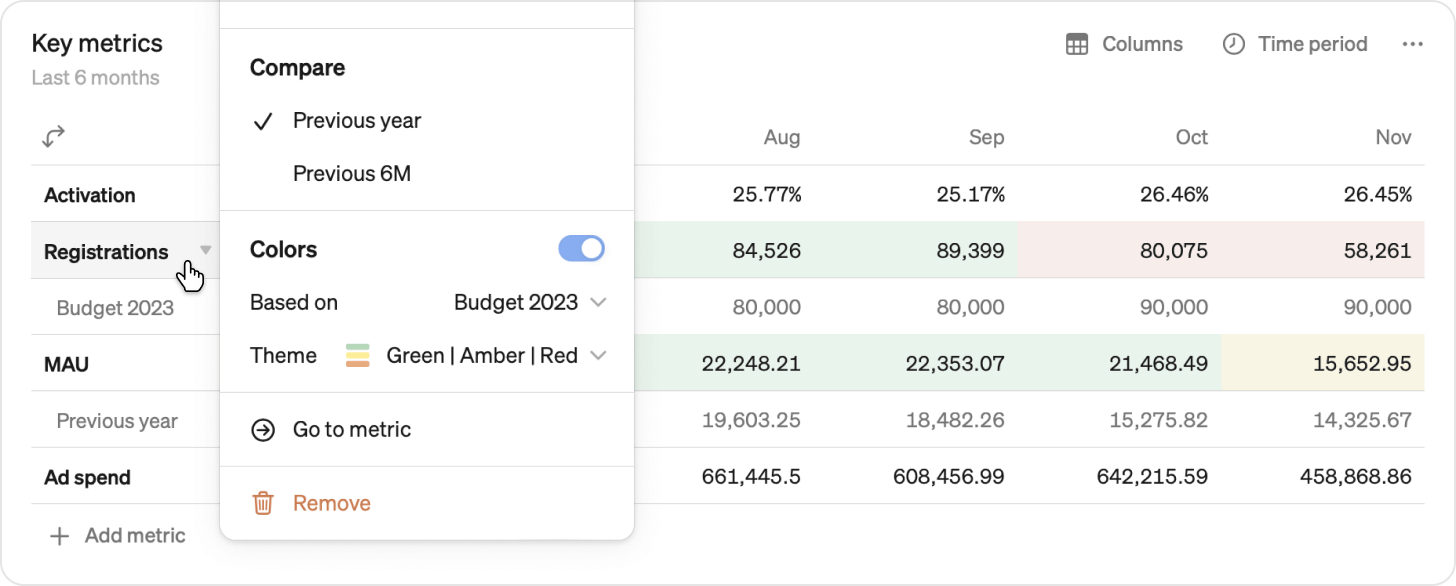
Color code your metrics based off:
- Based on actuals
- Compared to target
- Compared to previous year
- Compared to previous period
Drag, drop and Transpose
Flip the column and rows to switch which axis your metrics sit on.
Drag and drop metrics and dimension breakdowns to reorder them.
Time, breakdown, and filter
Hit the Edit-icon in the top right corner of a table to choose a time period, breakdown, and filter for your table.
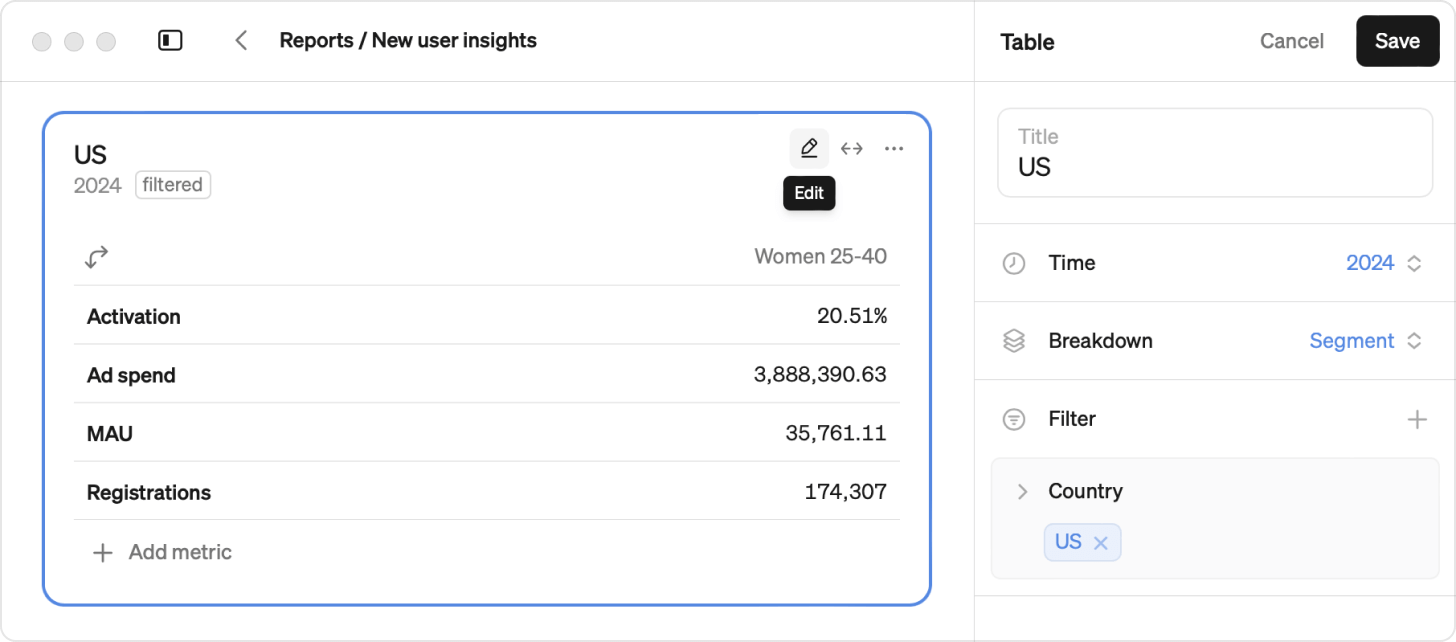
Select a time period: In the Time dropdown menu, choose the specific time period you'd like to display for your table. By default the table will display the last 6 months.
Choose a breakdown: In the Breakdown dropdown menu, you can decide how to group your data. Select either a time grain or a dimension to break down the data.
If your table uses a rolling period and daily breakdown, you can toggle Include today under Options to include today's values.
Apply filters: In the Filter dropdown menu, you can add dimension filters to narrow down the data displayed.
Sort by dimension values: You can sort tables alphabetically or by metric value to highlight top or bottom performance. Sorting by metric value will be based on the first metric in the table.
Group by dimensions: Add a second dimension to organize your table breakdowns into groups, for example, cities grouped by country.
Expand tables
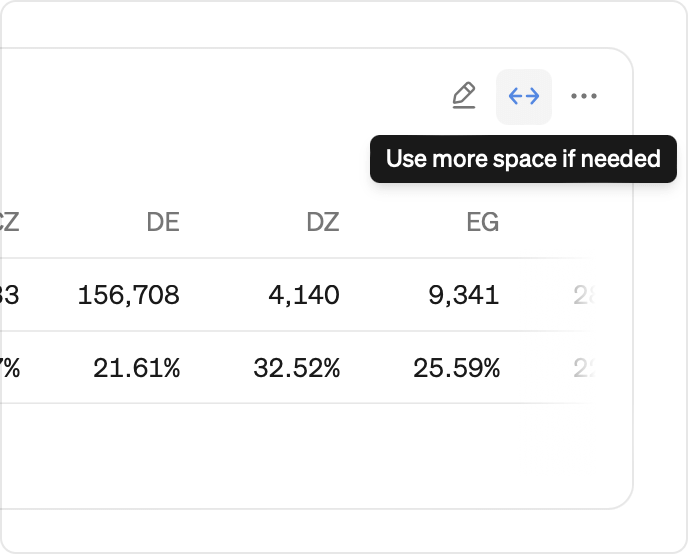
If your table has many columns, you can expand the table to match the width of your screen. Toggle the expand-icon in the top right corner of your table to make it wide.
Duplicate table
Duplicate a table from the top right corner of a chart.
Copy data
Copy all data in a table to the clipboard to paste it to any external document.
Download CSV
Download the full underlying data as a CSV file, with up to 1 million rows, including rows not visible in the report.
Note: If you're using version 1 of Steep targets, targets won't be included in the export. To include targets, upgrade to version 2.
Delete table
Delete a table from the top right corner of a table by clicking the ⋯ button
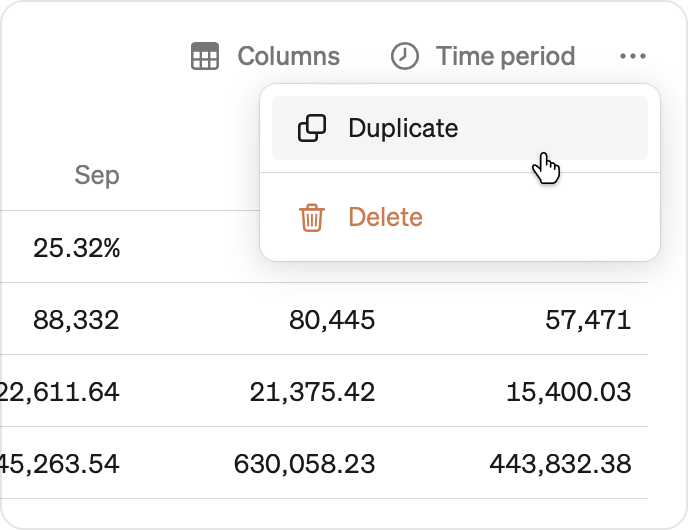
Table examples
Big numbers
With big number blocks, you can choose to add multiple metrics to one block or have a single metric broken down by dimension.
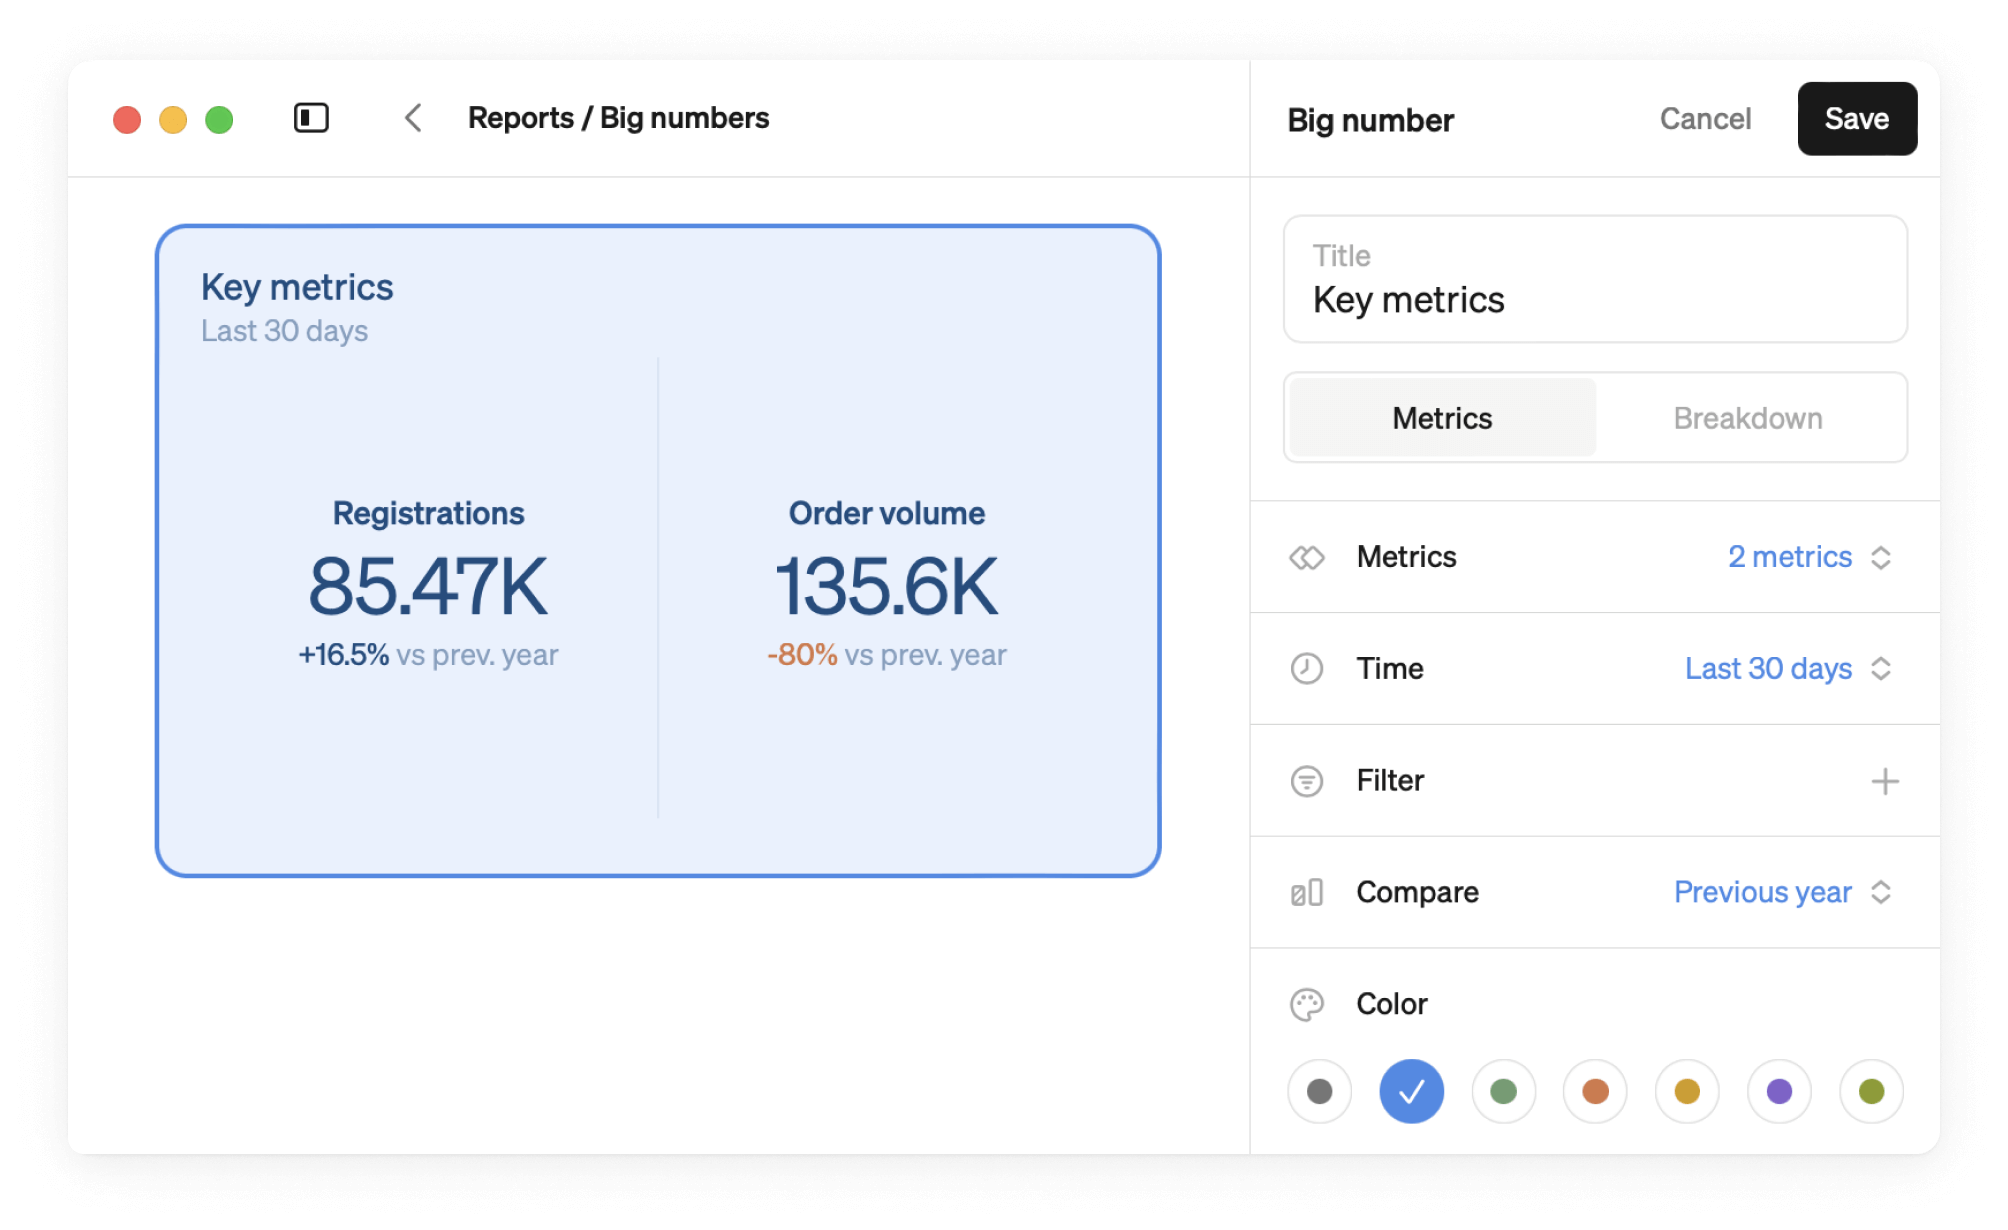
Add big number metrics
- Hover over the report to find the + button
- Click it and choose Big number
- From the edit panel, select the metrics you want to add
- Add a title
- Click Save
Add big number breakdown
- Hover over the report to find the + button
- Click it and choose Big number
- From the edit panel, select breakdown
- Select the metric you want to breakdown
- Select the dimension you want to use for the breakdown
- Add a title
- Click Save
Edit big numbers
Time
Set a time period. The same time period will be applied to all metrics in the same block.
For big number blocks on a daily time grain and rolling period, you can toggle Include today under Options.
Compare over time
Use the Compare field to compare your metric to the previous period or previous year. For example, if your big number shows the last 30 days, you can compare it to the previous 30 days.
By default, the comparison shows values for the full prior period. To show values only up to the same point in the prior period, open Options and set Comparison period to To date.
Filters
Once you have added a metric, you can apply a filter. If the big number block has multiple metrics, the filter is applied to all metrics. If one of those metrics does not have that dimension then no big number will be shown for that metric.
Colors
You can also choose from 7 different color options.
Big number examples 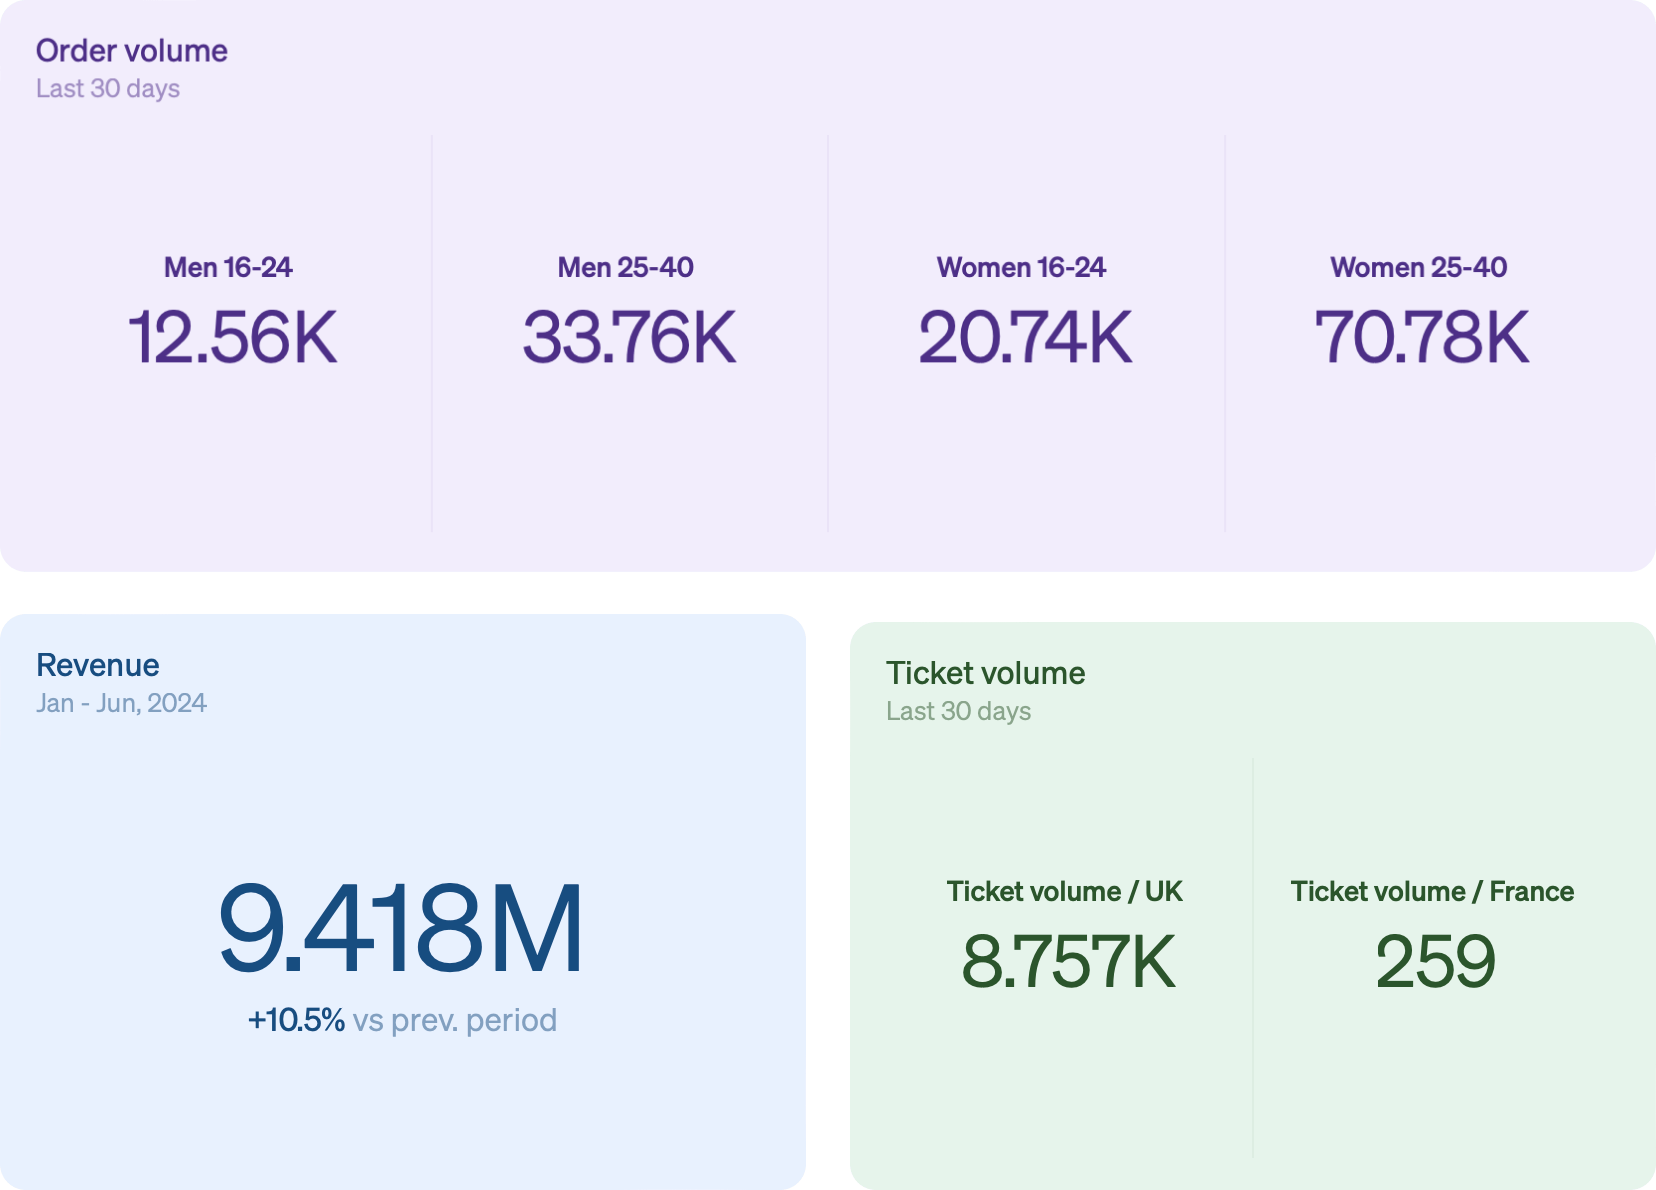
Filters
Filters are a powerful feature of reports, they allow you to build one report that can be viewed dynamically by your whole company. Report editors decide what filters to add, but all report viewers can use them.
Three types of filters can be added to reports. Time, dimensions, and time grain.
- Time can be set to weeks, months, quarters, years or custom date range. This lets you quickly navigate all blocks through time to get the full picture.
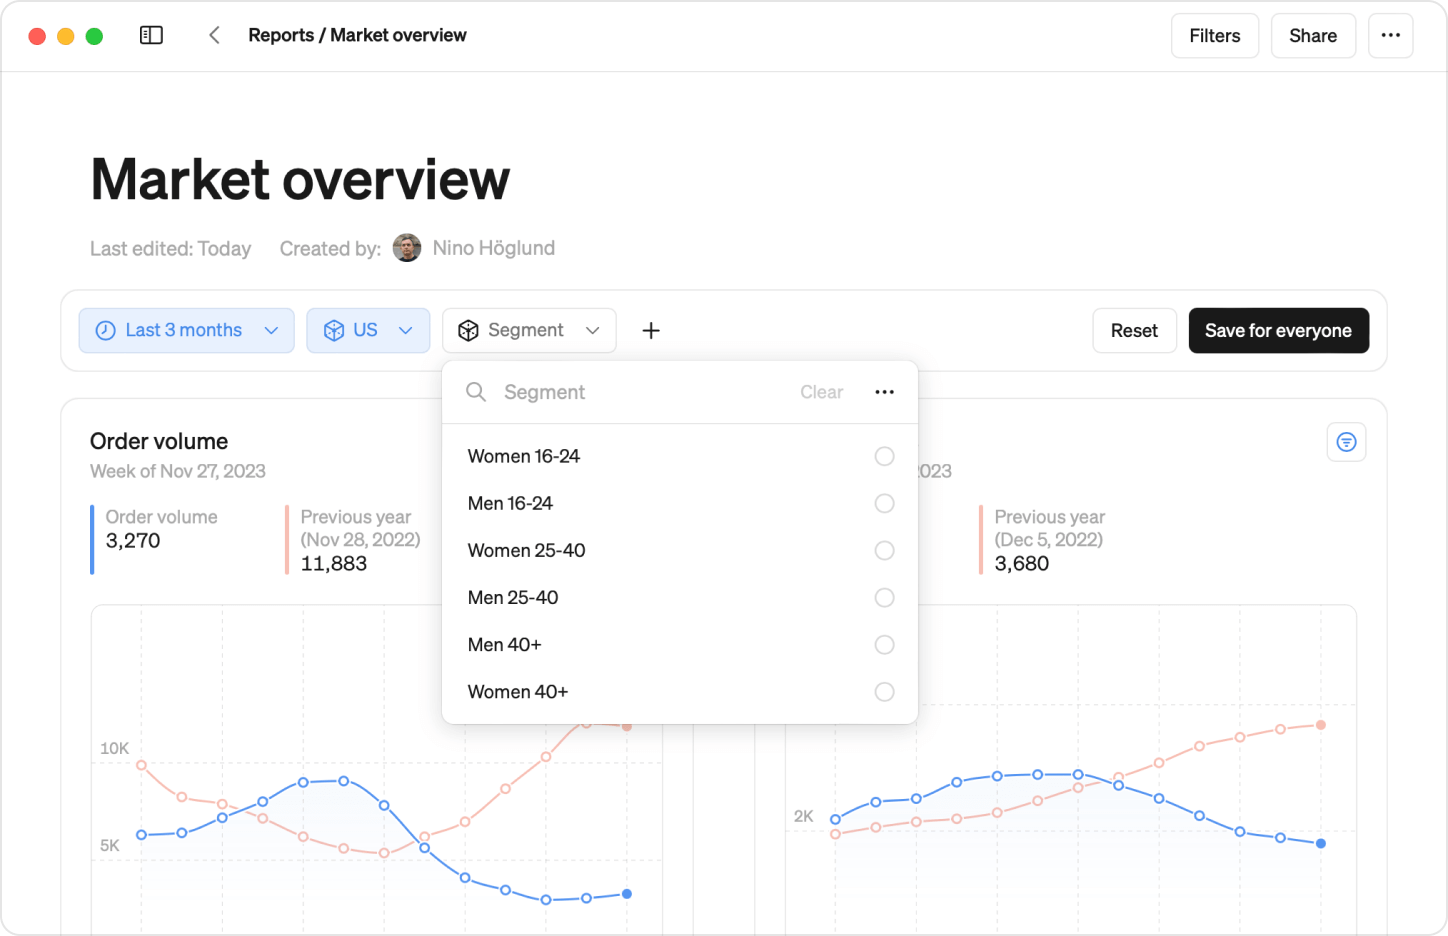
- Dimensions - pick any values you have available for the blocks in your report, for example, specific markets or segments, and drill down in all blocks at the same time.
- Time grain can be set to daily, weekly, monthly, quarterly, or yearly. This controls how your data is grouped and displayed across all visualizations in the report.
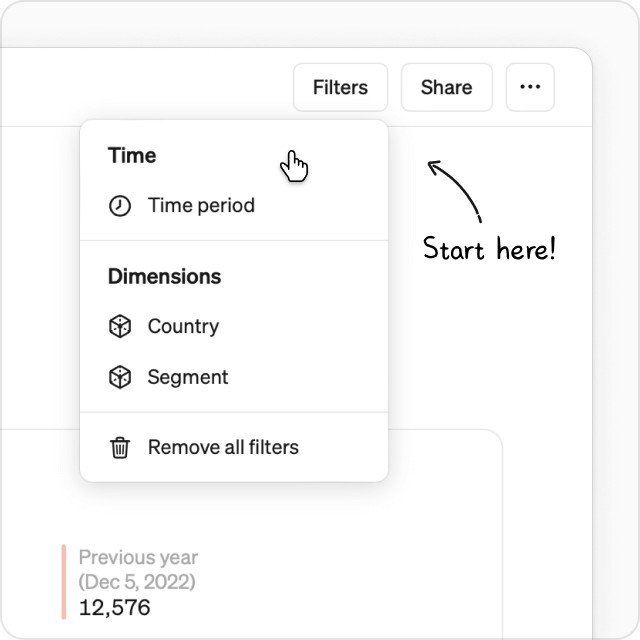
Add filter
To add a filter, go to the top right hand corner of your report and click Filters. Select which filters you want to use on the report
Remove Filter
There are two ways to remove a filter.
- Go to the top right hand corner of your report and click Filters. Click on the specific filter you want to remove or select Remove all filters.
- Click on the filter → … → Remove filter
Once a filter is added, the editor can choose to only use it one time or save it for everyone. If you save it for everyone the filter will be added to everyone currently viewing the report and all future viewers.

Use filter
Any viewer can explore a report using filters once they are added. Adding a filter will only change the report temporarily for the viewer, and be reset once the report is closed.
Filter logic
An active filter overrides a chart blocks saved set up. For example if you saved a chart to show a specific market such as the US and then add a filter to view the market France, the chart will show France.
Steep also treats dimensions with the same column name as the same filter, even if they come from different tables. For example, if you have two metrics that both use the dimension Country, applying a filter on Country will affect both metrics at once. This ensures consistency and makes filtering seamless across visualizations.
Time grains
Be mindful on chart time grains when setting up a report with time period filters. Any chart with a larger time grain saved, will appear empty when a viewer filters on a shorter time period. For example if the time grain on a chart is quarters and the filter is the last month, that report will show up empty. Setting time grains to “auto” for charts in a report with filters is recommended for the optimal experience.
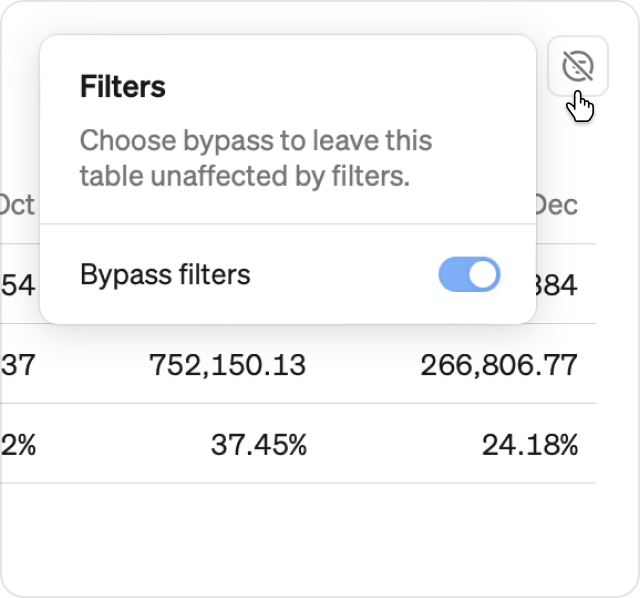
Bypass filter
In the top right hand corner of each chart and table you can choose to Bypass filters to leave those specific blocks unaffected by filters.
Use this to add a total or a benchmark chart to you report that will be left unaffected by any filter applied
Fixed and rolling periods
Charts and tables can either be set to a fixed or a rolling time period. Rolling time periods tracks the current date and is useful for reports that tracks the development of metrics over time. Fixed time periods stay fixed on the chosen period (e.g. Q1 2023) and is useful for reporting purposes or for analyses that focus on a specific moment in time.
Fixed period
Choose a specific period using the time stepper, like May, to create a chart with a fixed time period.
You can also use the custom date picker to display a specific fixed period.
Rolling period
Select a current period like Last 30 days and your chart will display a rolling period that updates daily.
Include today's data
For rolling periods on a daily time grain, you can choose to include today's data with the Include today option in block settings.
Copy data
Here’s how to easily copy data from a chart or table to use it in external tools like Google Sheets or Excel:
- Click “…” at the top right hand corner of your chart or table.
- Click 'Copy data'.
- Paste the data in your external tool.
Text and style
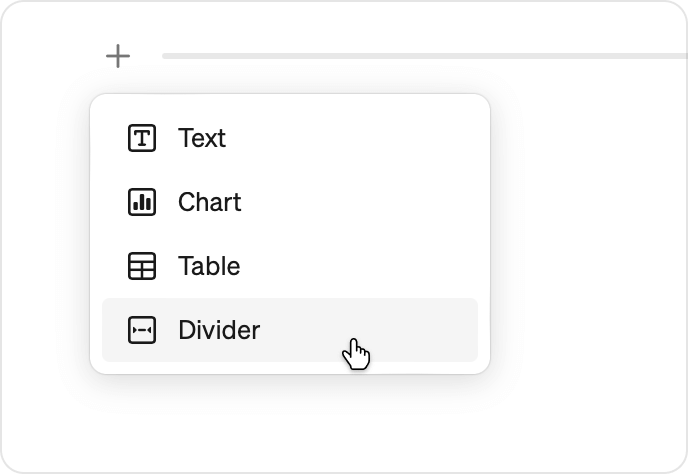
Add text blocks to your report, by clicking on the + button and select Text.
To format your text, simply highlight the text and apply any of the following styles:
- Large and small headings (H1/H2)
- Bold
- Italic
- Bullets and numbered lists
Divider
Insert a divider to visually separate sections in your report. Hit + and choose Divider to insert.
Drag and drop
Any content block in a Steep report can be dragged and dropped around the page. You can place up to four blocks beside each other in reports.
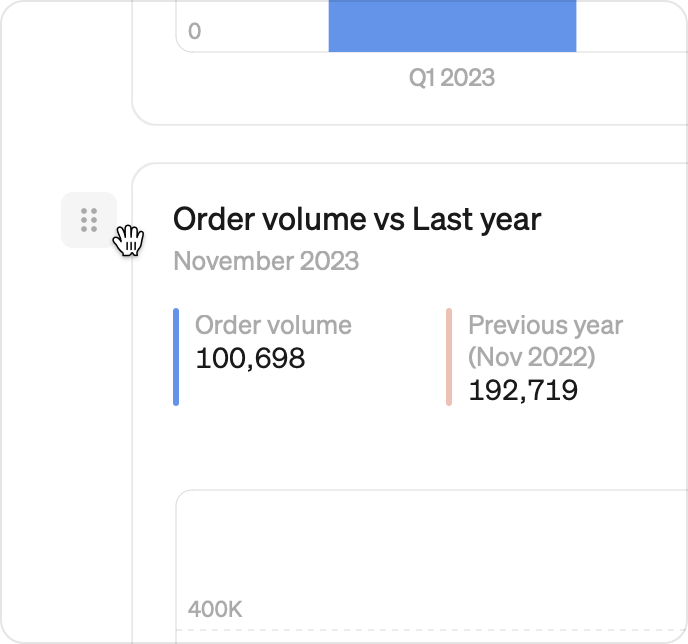
- Hover over any block of content and use the
⋮⋮icon that appears as a handle to to drag it around. - Blue guides will appear and show you where it will go.
- Release the block to drop it wherever you want it.
- Dropping a block to the left or right of another block will create a two-column layout.
Report icons
Add an icon to your Steep report to make it easier to find in your report list. Icons appear alongside report names everywhere within Steep.
- Hover above your report title and click + Add icon
- Pick an icon and a color
- Click the icon to edit or remove it
Have an icon idea or request? Let us know at icons@steep.app.
![]()
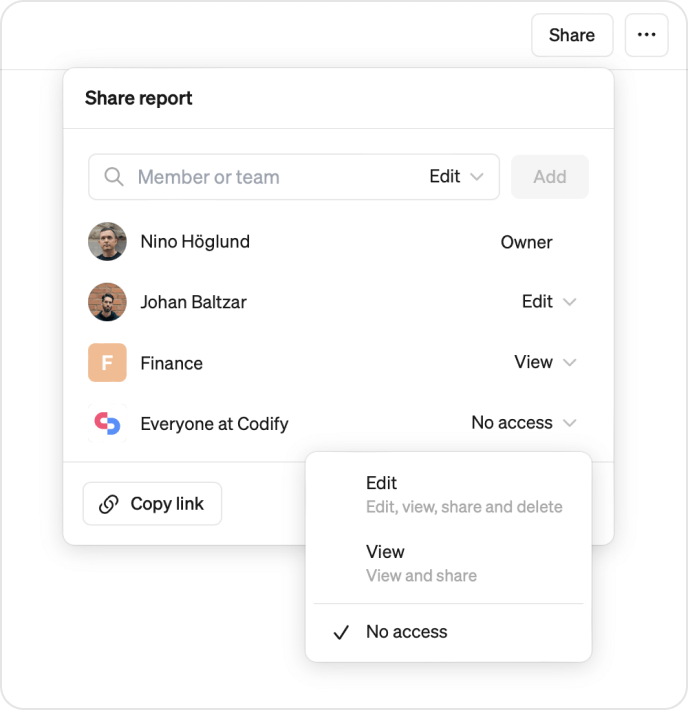
Share and permissions
Start working on your report independently and hit Share whenever you are ready. You can give view or edit access to:
- Individuals
- Selected teams
- Entire workspace
Admin can always change reports permissions.
Copy link
Open the share menu and copy the link to the report.
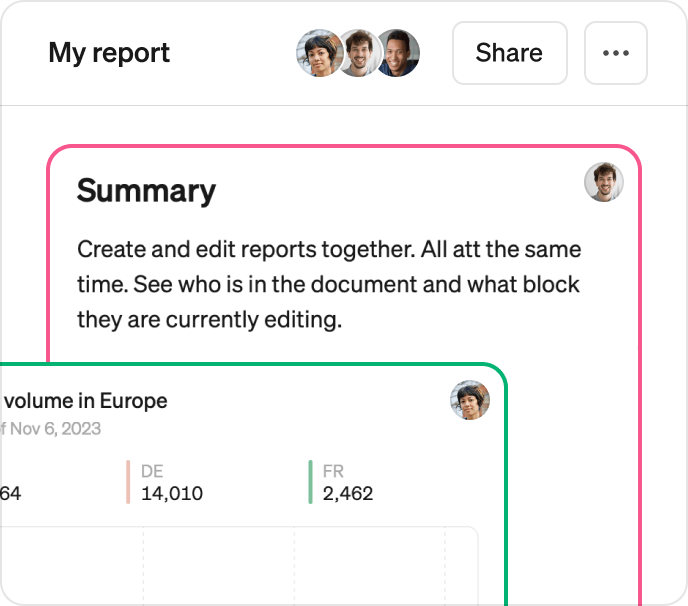
Collaborative editing
A group of members can collaborate on editing a report together. You can view the list of participants currently working on the report in the top right corner. Any updates made by your collaborators will be instantly reflected on your screen.
Full-width
Expand your report to full screen width, allowing you to utilize your whole screen to display your visualizations. Hit “…” in the top right of your report to toggle it on and off.
Slack subscriptions
Schedule report send-outs directly to your Slack channels—daily, weekly, or monthly. Get PDFs and live report links right where your team collaborates, ensuring everyone stays in the loop with the latest numbers.
Learn about Slack subscriptions ->
Download PDF
Create PDFs of your reports with crisp vector graphics. Hit "Share” in the top right of your report to download a PDF.
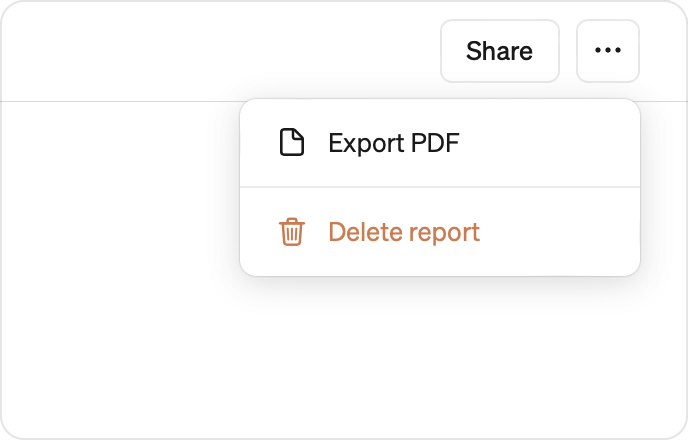
Delete report
Hit ⋯ in the top right of your report to delete a report.
Everyone with full access to a report can delete the report.